From tariffs and recession risks to renewables and rising demand, this article outlines actionable procurement strategies tailored to today’s evolving energy landscape.
Macro Energy Drivers
The passing of the Liberation Day tariffs created economic uncertainty in the US. With initial tariffs of at least 10% for all goods coming from other countries, the knee jerk reaction was for natural gas prices to sell off due to fears of an economic downturn. The prompt year’s contract (May 2025 – April 2026) sold off around 20% from $4.60/Dth to $3.70/Dth in the days following the announcement. With the more recent scaling back on all tariffs, except those imposed on China, natural gas has begun to increase back up towards its pre-tariff levels.
As uncertainty continues to loom on the lasting impacts of these tariffs, the main takeaway is recession fears are bearish for natural gas prices and will cause downward pressure. The main question in the market is how long this recession fear will continue and at what magnitude.
Aside from Texas, electricity markets across the country have been relatively stagnant for years from a growth perspective. NYISO hasn’t set a new record peak demand since 2013 and PJM and ISO-NE haven’t set a new peak demand since 2006. The story of the 2010’s was one of coal and nuclear power plant retirements, and reduction of electricity consumption broadly. That is no longer the case as AI, crypto mining, and electrification sweep the nation. Electricity consumption is anticipated to rise drastically over the coming years with no clear answer as to what will generate the needed power to support this growth.
In the short term, electricity and natural gas prices are largely impacted by the fundamental factors that impact supply and demand. The biggest indicators we see are highlighted below and their impact on prices.
- Increase of LNG Exports: Bullish (drives prices upward)
- Reduced or Stagnate Natural Gas Rig Counts: Bullish
- Flat Natural Gas Production: Bullish
- Natural Gas Storage Levels: Neutral to Bullish
- Recession Fears: Bearish (drives prices down)
New England
New England (ISO-NE) is framed with a natural gas constraint stemming from a lack of cooperation and connection with its neighbor to the south (New York). There is limited natural gas flowing into New England, specifically on cold winter days, for the simple reason that it is very difficult to site new natural gas pipelines either intra or interstate. With limited access to natural gas via pipeline, the region relies on expensive imported LNG. New England historically has the highest winter energy prices in the country for these reasons.
Recommendation: Long term renewables are set to take control of the marketplace given the renewable energy mandates in Massachusetts, Connecticut, and Rhode Island. In the meantime, taking advantage of depressed forward winter prices following this colder winter would be a prudent action. We would recommend buying here given that typically we see elevated prices following colder-than-normal winters, but those have been muted by recession fears for the moment.
New York
New York ISO (NYISO) has set aggressive renewable mandates on their generation mix requiring 70% renewable generation by 2030 (30% of electricity was renewable in 2023). With this goal in mind, New York has gone through iterations of offshore wind procurement, solar programs, and even set out to purchase wholesale electricity from Quebec’s hydropower. As of May 2025, all of the large wind projects have been canceled or suspended, leaving the only additive generation on the horizon being CHPE, a 1,250 MW transmission line bringing hydro power in from Quebec.
Recommendation: New York is behind the eight ball on reaching their renewable electricity mandate. As such, they will either reach their goals or could be caught short generation capacity during the transition. Until then, natural gas prices will continue to drive power prices in New York, so buying opportunities for power in New York will likely align with buying opportunities for natural gas.
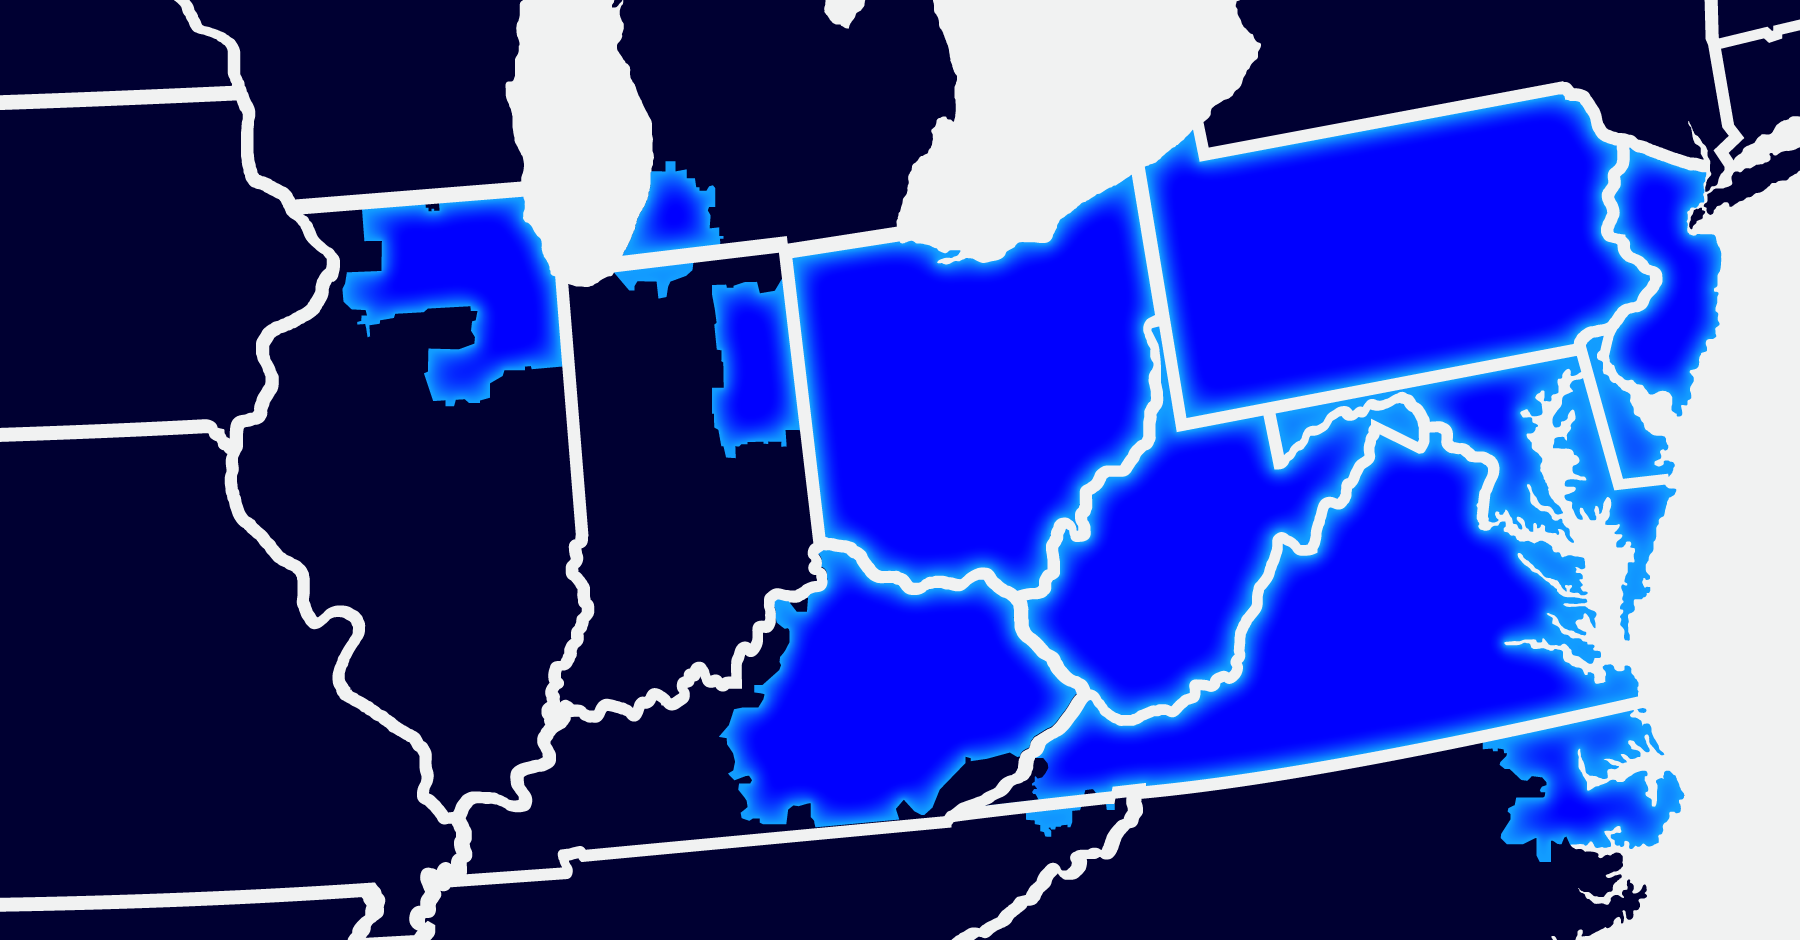
PJM
PJM is the central power agency governing 13 states from the Mid-Atlantic to the Midwest (from New Jersey to Chicago). Predominantly, this was a sleepy marketplace driven by slowly declining load and a generation fleet primarily of coal and nuclear assets built several decades ago. With the retirement of several coal and nuclear plants over the past year and a recent uptick in anticipated load growth there is uncertainty that PJM has enough generation to meet its electricity requirements over the next 5 years.
The capacity market is a mechanism PJM uses to ensure there is enough electricity generation by paying generators to be available when the grid needs them the most. As shown in Figure 1, in years past capacity has been generally declining as there has been enough generation to meet the required demand. However, the most recent capacity auction for the months of June 2025 to May 2026 saw a 5x increase for the majority of utilities across the region.
PJM Capacity Price History

Figure 1: Chart shows the 5x increase in PJM Capacity Prices for June 2025-May 2026, data from www.pjm.com/markets-and-operations/rpm.aspx
Looking beyond next year, there is real fear that data centers and crypto mining load will bring significant load growth to PJM. There have been significant interconnection requests, particularly in Virginia, Ohio, and Illinois, as these are key regions with access to high voltage transmission lines and fiber optic cables.
Recommendation: PJM will likely have high-capacity pricing for years to come and it is advised that businesses take proactive steps to reduce your peak demand when the grid is peaking. These demand reductions should significantly reduce the impact of these rising capacity costs. Additionally, natural gas generation is becoming a larger percentage of the generation fleet, creating a tighter correlation between forward natural gas prices and forward power prices. A buying opportunity still exists given the current recession fears.
Texas
Texas’ relatively low energy prices and generally beneficial regulatory landscape has attracted significant interest from crypto mining, industrial load, data centers, as well as continued growth of oil and gas in West Texas. As Figure 2 shows, the projections from ERCOT (TX power pool operator) have peak demand increasing to 144,000 MW’s by 2031 from our most recent peak of 85,199 MW’s last summer.
ERCOT Summer Peak Demand Forecast

Figure 2: Chart shows the 5x increase in PJM Capacity Prices for June 2025-May 2026, www.ercot.com/gridinfo/load/forecast
For the duration of ERCOT’s deregulated market, they have used a 4 Coincident Peak (4CP) methodology to allocate transmission cost to large power consumers in Texas. This charges each consumer for their contribution to the overall grid peak in June, July, August, and September. Senate Bill 6 in the current Texas legislative session required the Public Utility Commission to evaluate whether this allocation methodology continues to be just and reasonable. Any changes to this methodology could have significant impacts on large users in Texas.
In November of 2023, Texas passed Proposition 7 enacting the Texas Energy Fund, a $5.4 billion incentive for dispatchable generation. Due to the program requirements, the accepted applicants are almost entirely natural gas generation sources totaling 8,489 MW. Of the original 8.5 GW’s; 2.1 GW’s (~25% of the awarded generation sources) have announced that they have canceled their projects and thus will not be helping to ensure grid stability.
Recommendation: ERCOT is facing an uphill battle with meeting the demand that is projected to come online over the coming years. This leads us to believe that buying into a medium to long-term position now for electricity, in this backwardated (i.e., outer years are cheaper than current years) market, is advantageous as it will get clients through this period of uncertainty and volatility.
California
California electricity is predominantly driven by solar and other renewable energy with the balance coming from natural gas-based generation. California has limited production of natural gas and thus transports most of its requirements from Texas and Canada. In the last year or so, the Texas Permian basin has had a glut of production and has been transporting cheap gas to CA which has created a downturn in the electricity and natural gas markets. Recent global economic events have combined to deflate oil prices in West Texas to their lowest levels since 2021, reducing the possibility of continued growth of large amounts of natural gas in West Texas and New Mexico. This doubt has halted the slide in prices and the market has bounced off of its 3-year lows, as shown in Figure 3.
Additionally, this past month, the West Coast Canadian LNG terminal in British Columbia began operation, also decreasing natural gas deliveries into Washington state, adding upward pressure to regional supplies and, therefore, prices as well.
CAISO Calendar Year Wholesale Electricity

Recommendation: The California electricity and natural gas markets look to be some of the most attractive buying opportunities in the country. Even with recent negative news, forward natural gas and power prices are very favorable compared to the last several years. Hedging a portion of your exposure at these prices would be highly recommended.