
Market Info & Updates

Topics: Natural GasPJMNYISOERCOTISO-NE
Services: Procurement & Risk ManagementReliability
Industries: All industries
A warm winter could bring lower natural gas prices. But in the Northeast, the fuel needed on cold days is getting more expensive. Even with a strong El Niño in the forecast, energy buyers still face the risk of higher prices when cold weather arrives.
Heading into winter 2026–27, those two forces are moving prices in different directions. Expectations for mild weather are helping natural gas prices fall in much of the country. In the Northeast, higher costs for imported fuel are pushing prices up. The outlook for your business depends in part on where your facilities are located.
How Europe’s weather can affect Boston energy prices
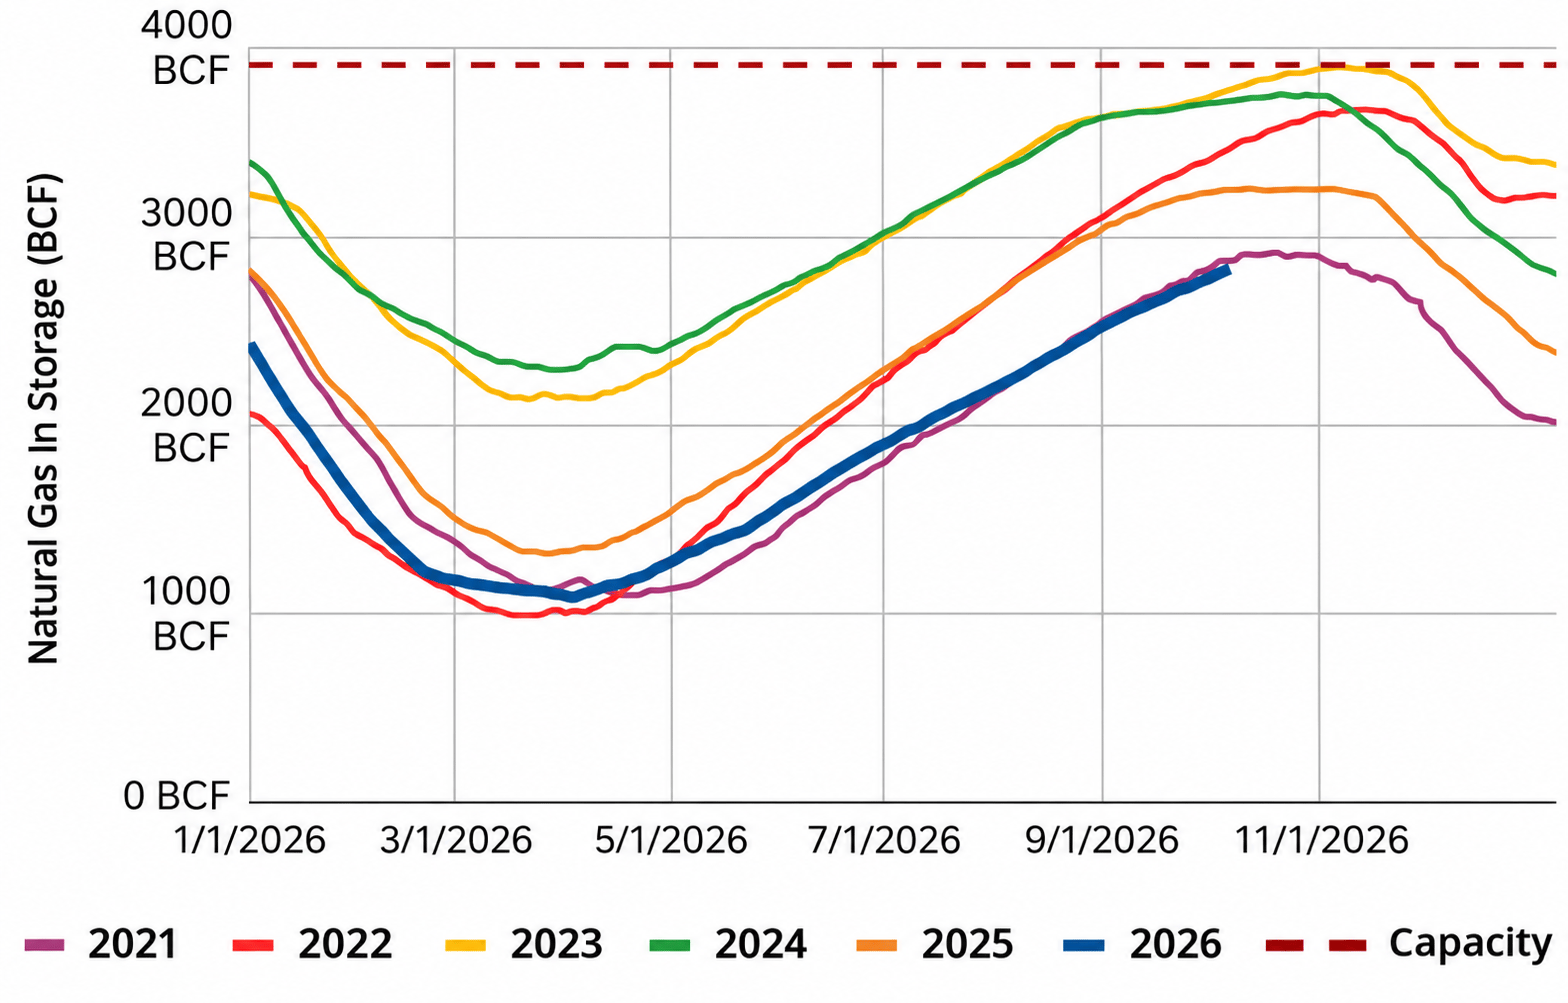
The connection starts with liquefied natural gas, or LNG. Europe imports LNG from the United States and through the Strait of Hormuz, which has seen limited traffic due to the Middle East conflict. Disruptions to shipments through the strait have made Europe more dependent on U.S. exports. Europe had little gas in storage coming out of last winter, and, as shown by the blue line in Figure 1, its supplies remain unusually low heading into this winter. LNG prices are also much higher than a year ago.
Boston also needs imported LNG on the coldest winter days to keep up with demand. When that demand is high, the pipelines running through New York cannot deliver enough gas to New England. LNG helps fill that gap, but buyers in Boston have to compete for cargoes in the same market as European buyers.
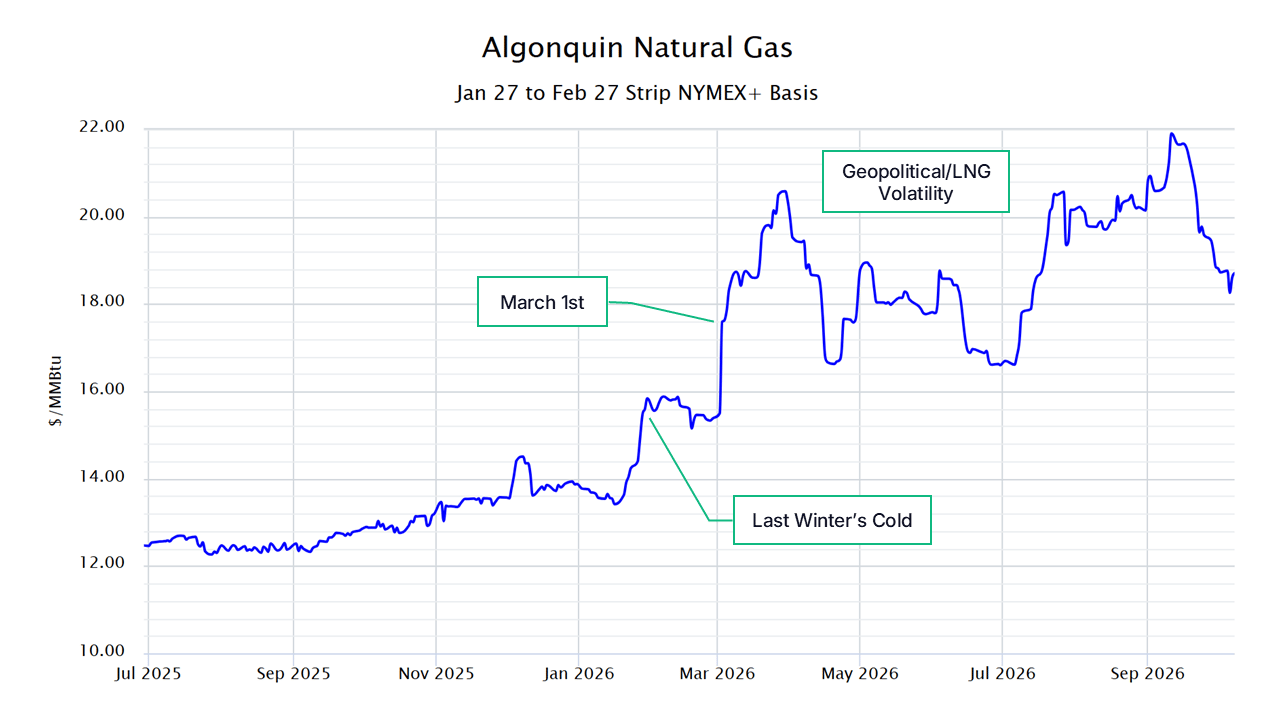
That connection is showing up in the price of gas for delivery to Boston in January and February 2027. As shown in Figure 2, prices rose after cold weather last winter, then rose again when the Strait of Hormuz shut down on March 1. Since then, changing expectations about the conflict have continued to move prices.
How long the disruption lasts matters. Prices rose when hostilities began and have reached new highs as the disruption has continued. With Europe still short on stored gas, the cost of buying an LNG cargo for a cold week in Boston remains a concern.
The effects reach beyond New England
The pipelines that supply Boston connect to pipelines in New York and New Jersey. When gas becomes more expensive in Boston, that can affect prices farther south too. So far, the increase in New York and New Jersey LNG prices has been smaller than in New England.
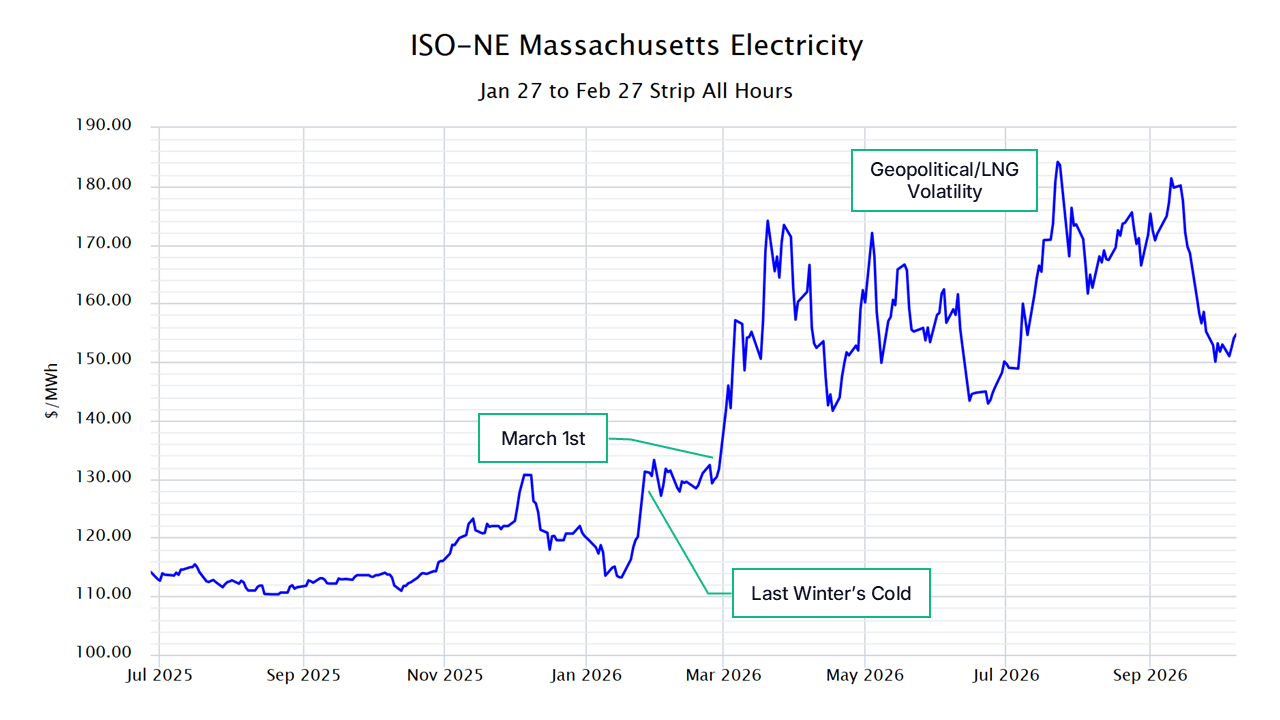
Electricity prices are more closely connected. New York and New England buy and sell electricity to each other and rely on each other during cold weather. That means New York electricity prices can rise and fall sharply along with New England’s, even when New York gas prices move less.
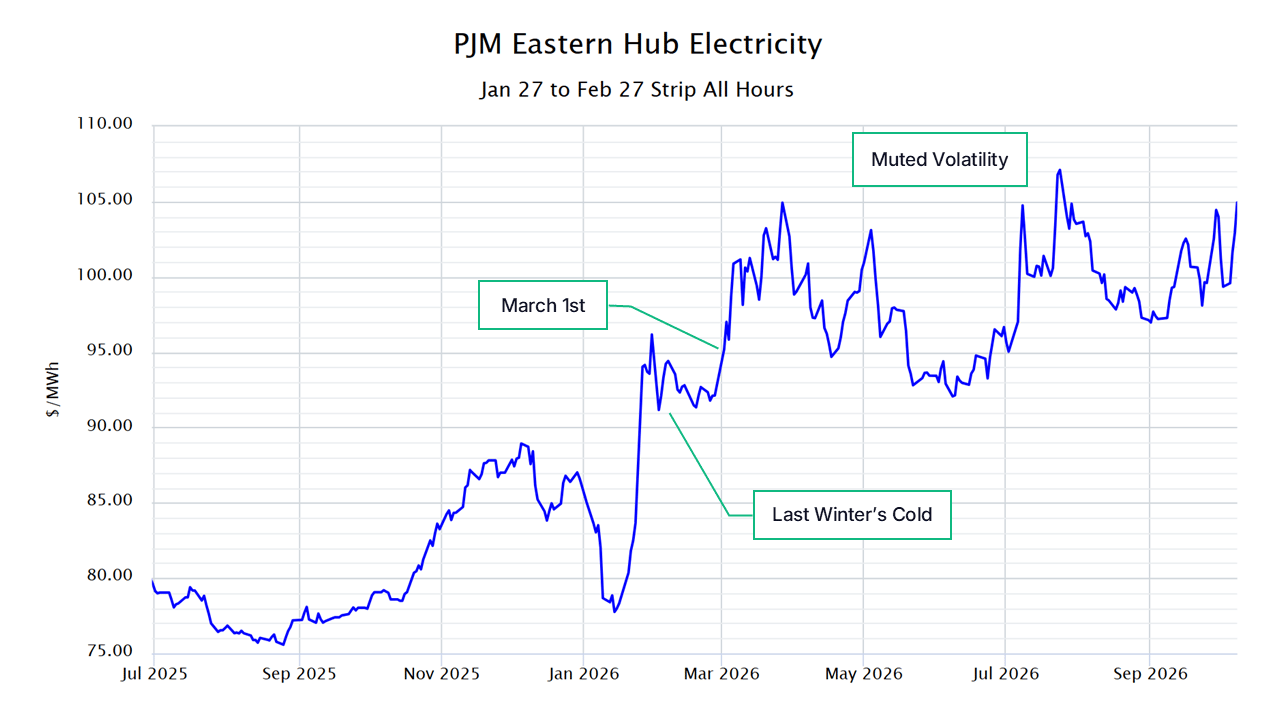
ISO-NE Massachusetts winter electricity prices have seen sharp swings, as shown in Figure 3. Farther south, prices in PJM East, which includes New Jersey, eastern Pennsylvania and Delaware, have stayed within a much narrower range (Figure 4). That region gets more influence from gas produced in Appalachia, and the effect of higher LNG costs becomes smaller farther west.
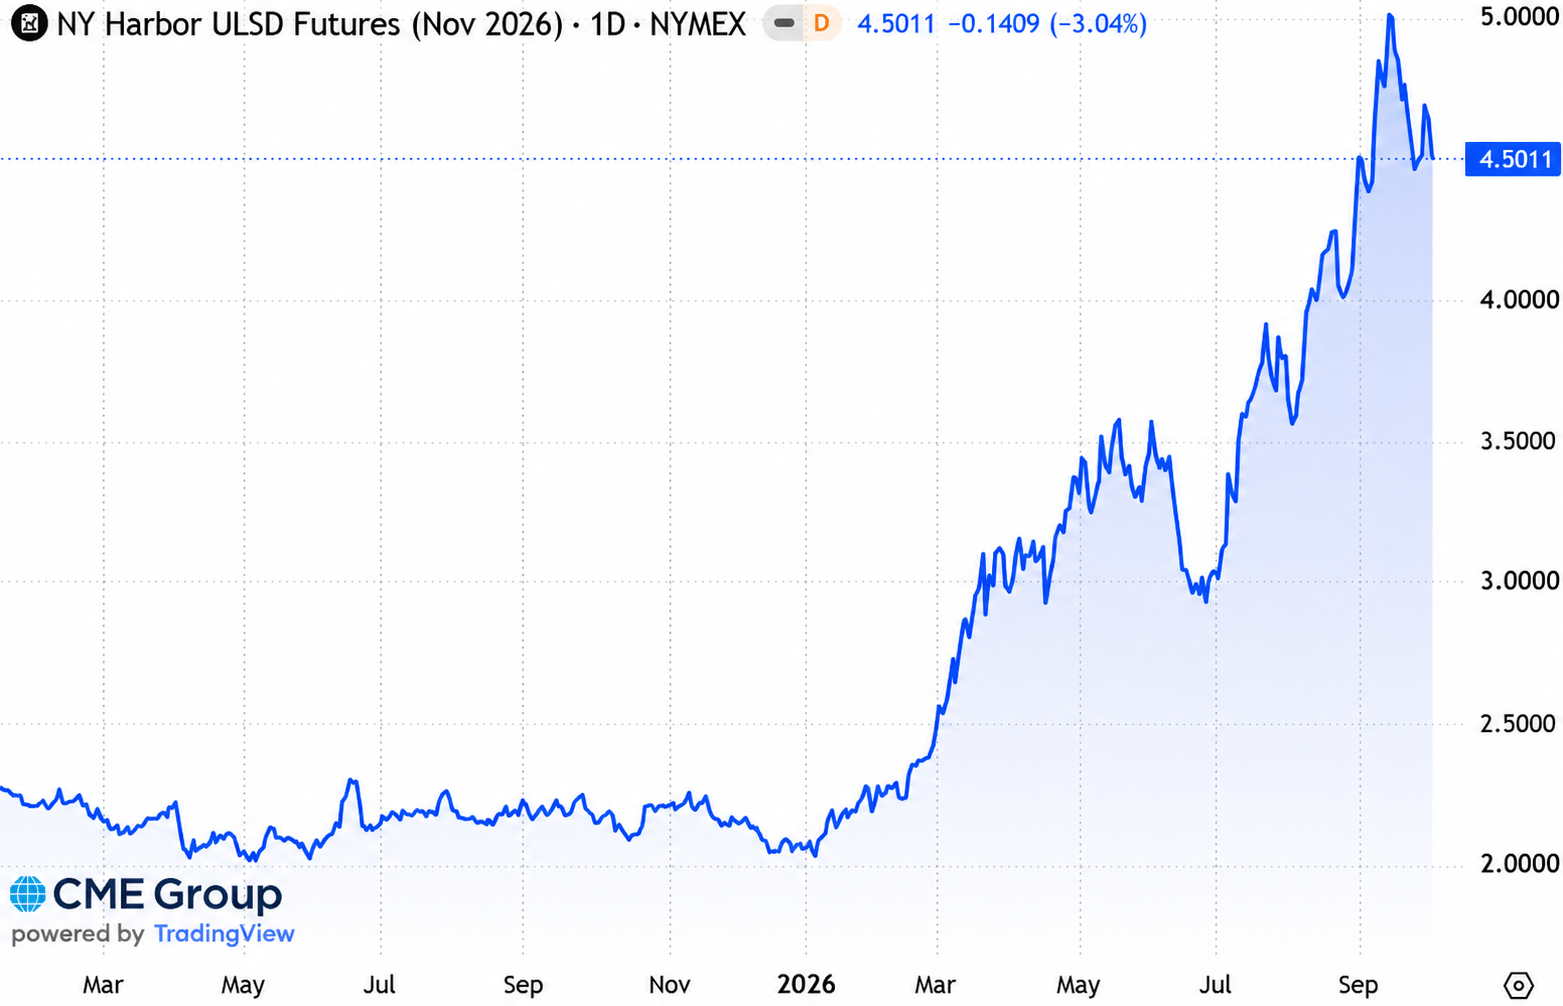
Natural gas is not the only fuel affecting Northeast electricity prices. On cold days, some power plants switch to fuel oil because there is not enough pipeline capacity to supply both heating and electricity generation. But, as shown in Figure 5, diesel and fuel oil are also more expensive this year. Switching fuels does not necessarily mean a lower cost for making electricity.
El Niño expectations have already moved the market
In much of the country, natural gas prices have been falling as the market expects a strong El Niño and a mild winter. Those expectations are already built into prices.
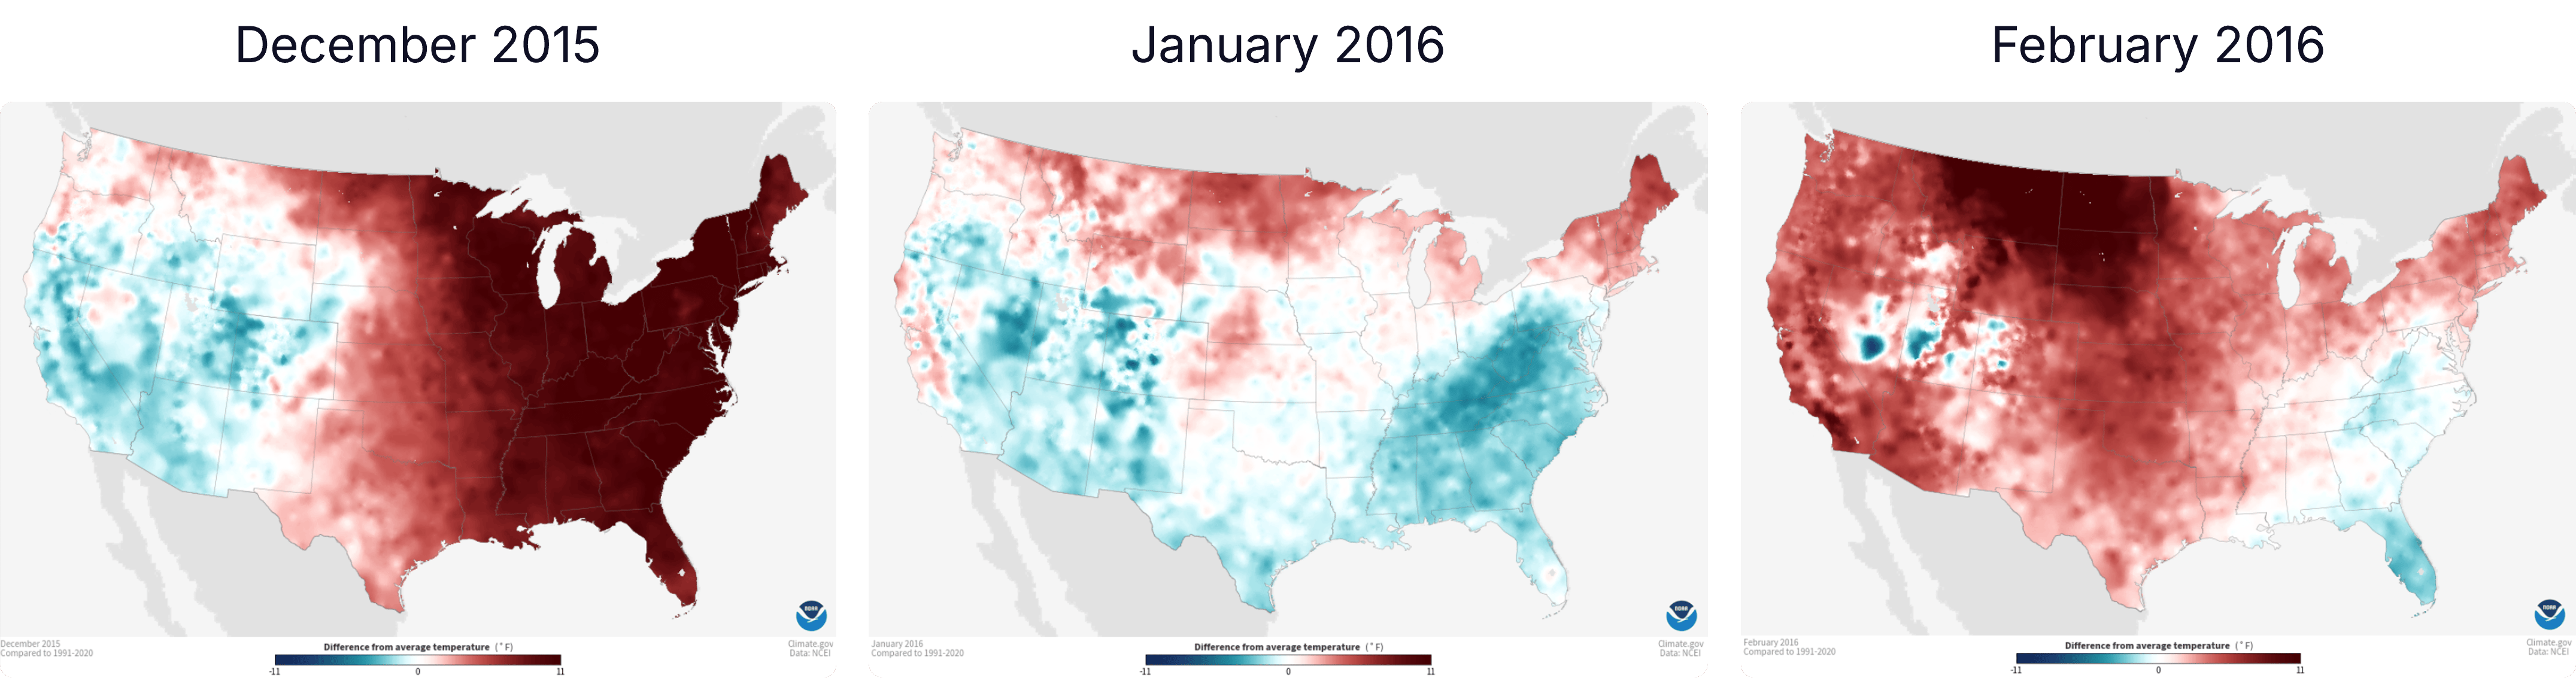
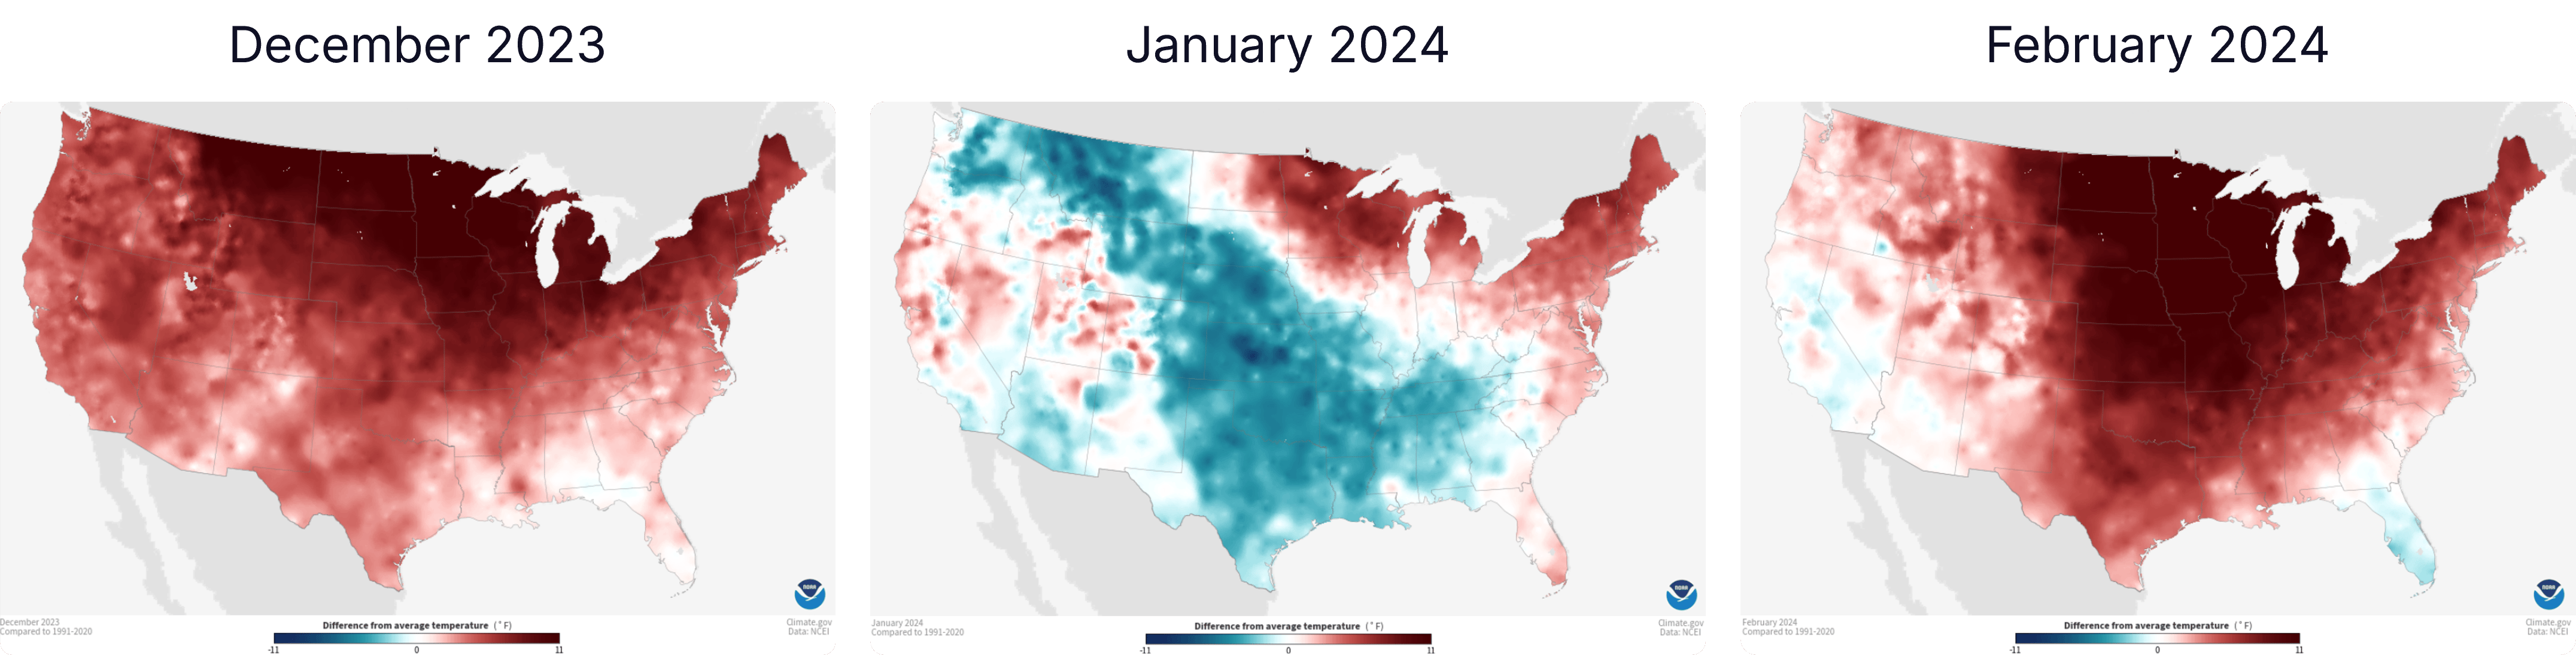
As shown in Figures 6 and 7, the winters of 2015–16 and 2023–24 offer two examples of what a strong El Niño winter can look like. Both had a very warm December, a January with a mix of warmer and colder conditions, and a warm February. Natural gas prices during those winters were among the lowest seen since the NYMEX Henry Hub contract began trading.
There are other winters with mild weather to compare, so those two examples cannot tell us for certain what will happen this year. Still, the market has been expecting a similar result, and natural gas prices have fallen as that forecast has developed.
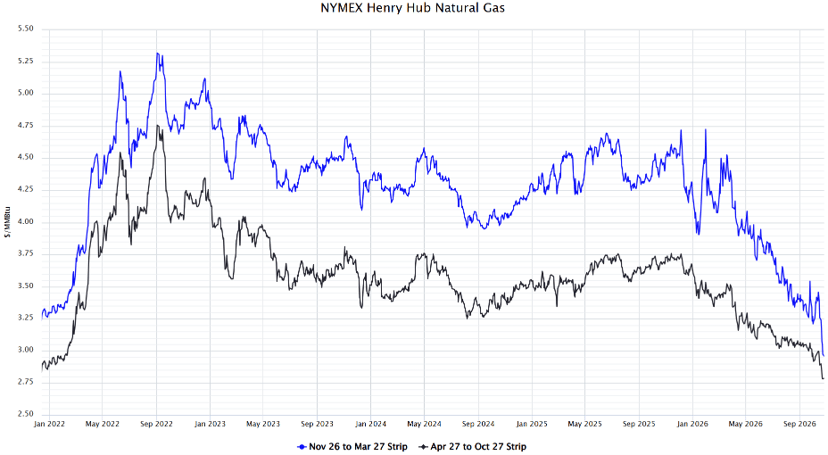
The specific geographic market also matters. NYMEX Henry Hub reflects the price of gas in Louisiana. Figure 8 shows that price has been falling with expectations for a mild winter. Boston faces the added cost of bringing in LNG, which has been moving in the opposite direction. A lower Henry Hub price does not mean the gas delivered to every location will become cheaper by the same amount.
A warmer winter overall can still include cold spells and winter storms are still likely during an El Niño year. Temperature severity and the duration of colder weather will ultimately determine the effect on prices and the grid.
PJM and ERCOT face different reliability questions
In PJM, the intensity and length of a cold spell matter. The mix of power plants supplying the region has not changed much in recent years. That leaves PJM facing many of the same challenges if another large winter storm brings very cold weather for a long time.
PJM also supplies electricity to neighboring regions. When it has less electricity to spare, it has less available to export. A storm that affects several regions at once could put pressure on PJM and the areas around it.
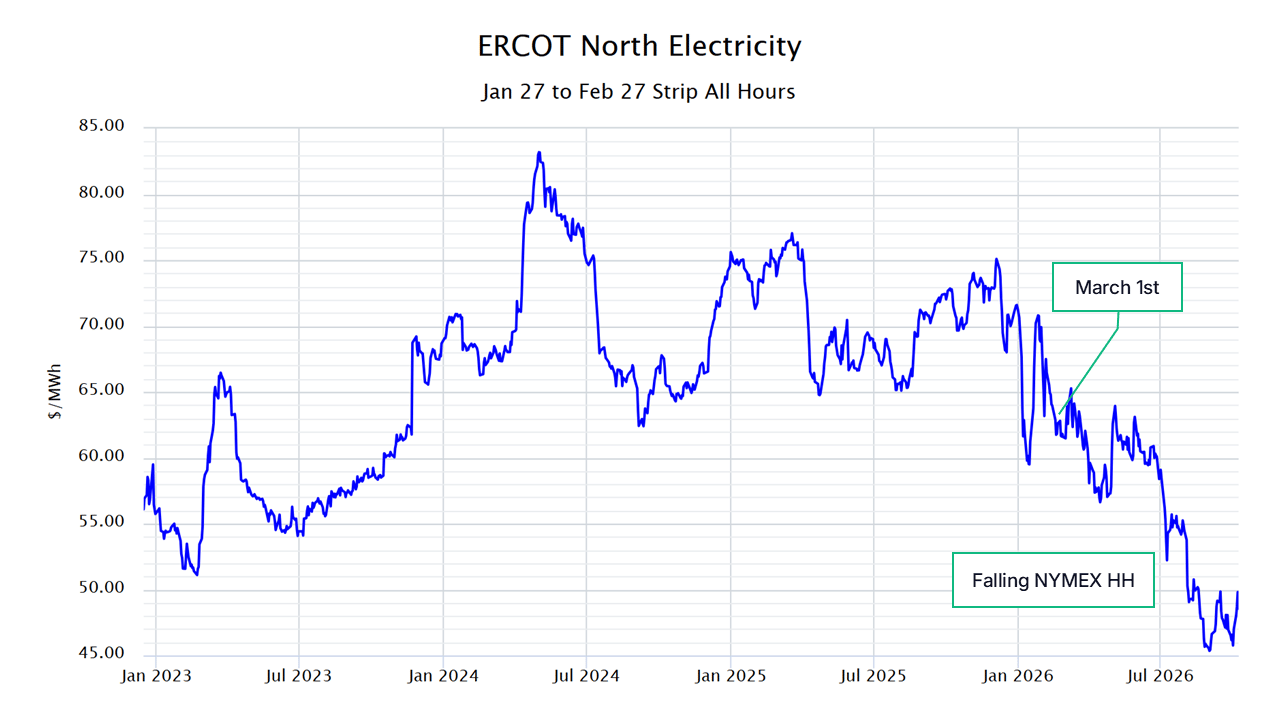
ERCOT has added more solar power and battery storage, improving its ability to handle cold weather compared with several years ago. That does not guarantee it could get through another Winter Storm Uri without problems, but it is much better prepared to handle a storm than it was six years ago. The amount of excess electricity available above forecasted demand is growing in ERCOT, but shrinking in PJM. ERCOT’s winter electricity prices have been falling, as shown in Figure 9. Recent sharp swings in PJM’s prices for immediate delivery have added to concerns about how much supply it has to spare. Those concerns have made it harder for prices for future electricity delivery to fall, even as natural gas prices decline.
Waiting for spring carries its own risk
If your electricity contract expires this fall, should you sign a short contract and wait until spring to make a longer purchase? The answer likely depends on your market. A warm winter could help prices fall, but the market is already expecting that warmth. Cold weather could still push prices higher, especially in the Northeast, where LNG and fuel oil are more expensive.
One option is to buy part of what you need now and purchase the rest later. For example, you could secure a price for 50% of your electricity needs for the next two years, then buy the remaining 50% at another time. Both purchases cover the same two years. With this approach, you’re spreading out when you buy, rather than choosing one day to set the price for everything.
The same idea applies if you still need to buy energy for this winter. Covering some of your December and January needs now can help protect against higher prices during a cold spell. If the winter turns out to be warm and prices fall, you could still have room to take advantage of lower prices for later delivery periods.
Waiting could bring an opportunity, but leaving your entire winter budget dependent on warm weather carries risk. Your energy advisor at 5 or account manager can help you decide how much to buy based on your locations and how much price uncertainty your business can handle.
 Nov. 17, 2026
California Direct Access: Why the Lowest Electricity Price May Not Be the Best Deal
 Nov. 9, 2026
Bring Your Own New Capacity: A New Opportunity for Demand Response
 Nov. 9, 2026
New SBTi Rules Could Change What You Pay For RECs
 Nov. 4, 2026
5 Acquires Legacy Energy, Expanding Our Reach in PJM and MISO
 Oct. 20, 2026
El Niño: What California Energy Buyers Should Know About Energy Prices
 Oct. 9, 2026
Winter 2026-27 Outlook for Gas and Power Markets: 5 Things to Know from our Live With 5
 Sept. 30, 2026
California’s Electricity Market Is Changing: What Energy Buyers Need to Know About EDAM and Resource Adequacy
 Sept. 10, 2026
Buy or Wait? Why Waiting is Also an Energy Buying Strategy
 Sept. 10, 2026
New Rules, New Developments: An Update on Data Center Regulation
 July 31, 2026
5 Things to Know From Our Webinar "How Data Center Growth is Reshaping Power Markets"
 June 29, 2026
Managing Regulatory Risk: How Consumer Power Advocates Helps New York's Largest Nonprofits
 June 29, 2026
ERCOT Market 3X-ing Coincident Peak Method, Moving from 4CP to 12CP