For as long as we can recall, there has been a significant difference between the price of capacity in upstate New York compared to capacity prices in New York City. It was common for capacity to trade at $3 to $5/MW-day in upstate New York and $15 to $18/MW-day downstate.
The reason for this distinct price difference was a simple matter of supply and demand. In general, there has been more electricity demand and fewer generating assets to meet the high demand for electricity in and around New York City. For the last 20 years, these conditions have led capacity to be four to five times more expensive in the downstate regions of New York. This price imbalance is beginning to change and for the first time in deregulated electricity history, the spot price for capacity in New York City (blue line) recently cleared at the same price as upstate (red line), as shown in Figure 1. For electricity market analysts, this is similar to the planetary conjunctions that excite astronomers.
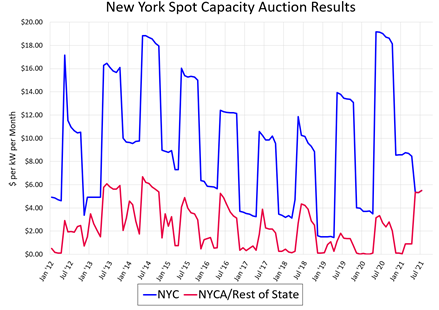
Figure 1: New York Spot Capacity Auction Results from 5
A similar phenomenon is observed in forward capacity markets. Figure 2 shows the forward capacity price in New York City for the summer of 2021 and 2022. This chart shows that the price of summer capacity has been consistently falling over the last 18 months and for this summer, it reached its all-time low of $5.01/MW-day, which is a price at which capacity is expected to trade in Syracuse as opposed to New York City.
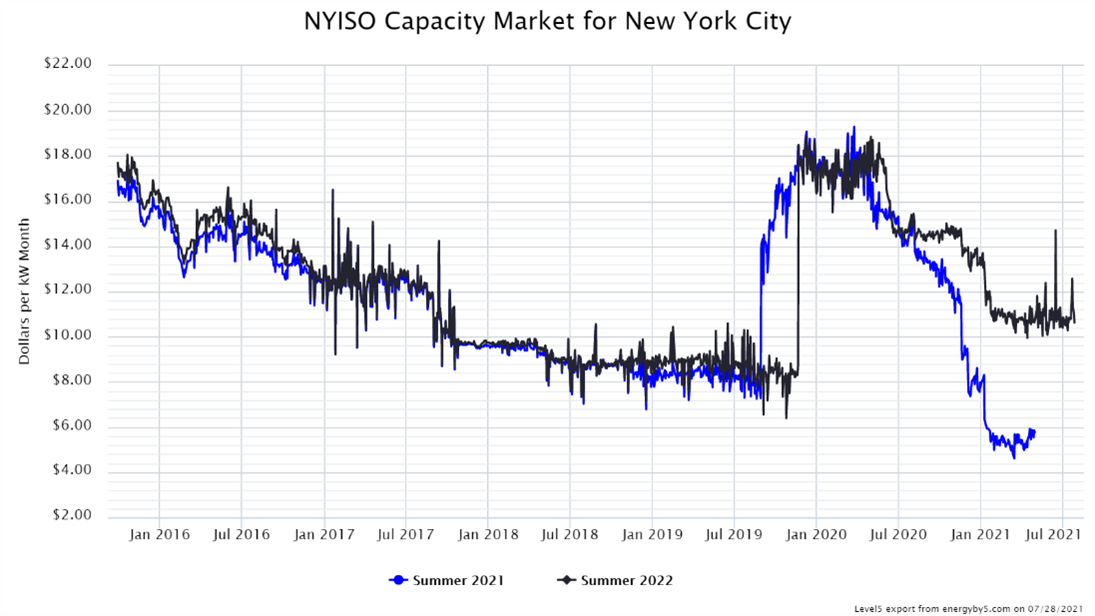
Figure 2: NYISO Capacity Market for New York City from 5
There are several factors driving the convergence in upstate and downstate capacity prices. One driver is the higher reserve margin required in New York. The reserve margin is the difference between the anticipated peak load for a given year and the amount of cleared generating capacity purchased in the capacity auctions. Over the last year, the reserve margin in New York increased from 18.9% to 20.7% - meaning that there is a larger increase in the amount of capacity purchased than the increase in demand throughout the state. With demand static or declining across the state, the total capacity required is remaining constant and load is slightly decreasing.
Additionally, the rules around the amount of capacity that must be purchased within New York City changed. Last year, 90% of the capacity purchased for New York City clients had to come from in-city resources. This year, that amount was reduced to 80.3%. This change, coupled with lower electricity demand forecasts in the city, contributed to the lower prices shown in Figures 1 and 2 and the convergence of upstate and downstate capacity markets.
In terms of wholesale electricity, the upward trajectory of the forward curve continues. Figure 3 shows the forward electricity curve in New York City for calendar years 2022 through 2025. This current bull market is driven by the price of natural gas, like many other electricity markets across the country. Most analysts do not see many bearish indicators to suggest that this market will change direction in the near future.
Clients who need to make electricity purchases over the next 18 months should consider taking action to mitigate the risk that electricity prices continue to climb. In this market, there is much more upside risk than downside potential. Buyers should consider offers today for any contracts that expire through the end of 2022. The one silver lining is that lower capacity prices in New York City will take some of the sting out of this current bull market.
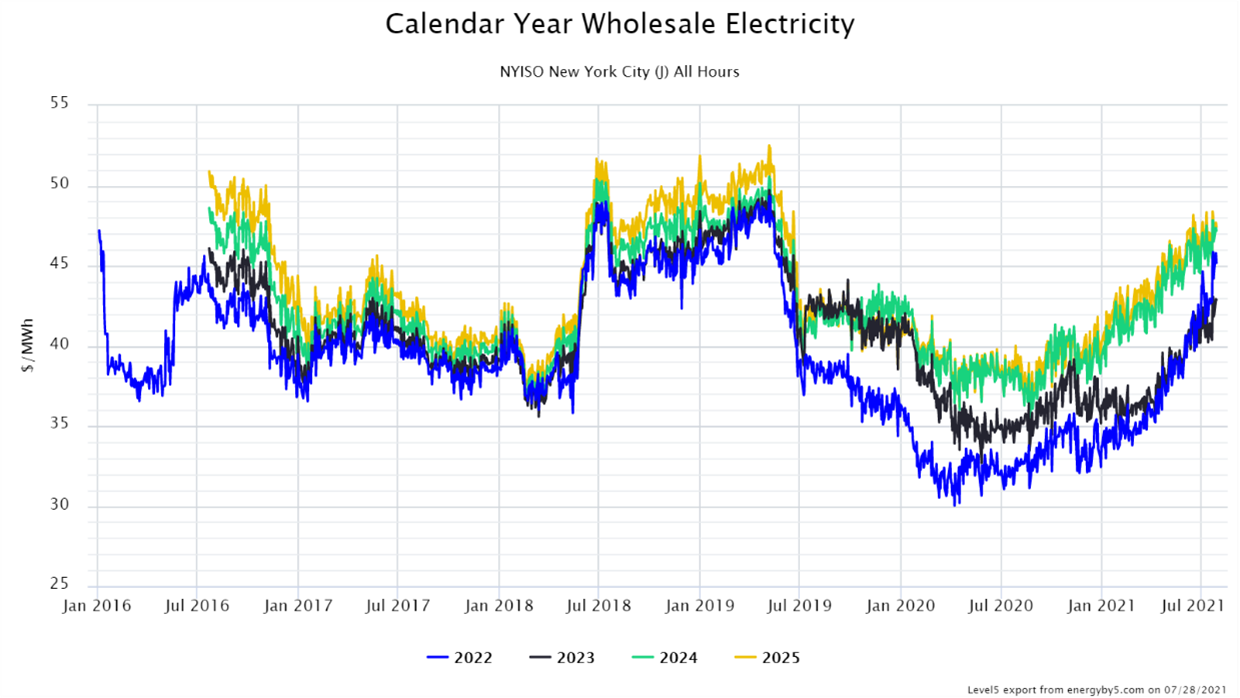
Figure 3: Calendar Year Wholesale Electricity from 5