Doesn’t the first cold front of fall always just feel so glorious? Texans will tell you that 85 degrees Fahrenheit never felt so good. After over four months of sweltering heat in Texas, with triple-digit heat index values as the rule rather than the exception, on Tuesday, September 21, 2021, a small shot of Arctic air made it all the way to the Texas Gulf Coast. Finally, Texans received some relief from the high humidity levels statewide and overnight low temperatures plunged into the 60s as far south as Brownsville. This front officially marks the end of the 4CP season, and of summertime in general, in Texas.
All in all, it was an uneventful summer in ERCOT, which is by no means a bad thing. Following the disastrous events in February caused by Winter Storm Uri, many market participants were rightfully concerned about the state of the grid going into summer - the time of year that tends to physically stress the grid the most. ERCOT did take some corrective measures this summer that were new, relative to years past, including, 1) more pro-active calls for energy conservation in advance of extreme weather events (something that ERCOT caught a lot of flak for not doing in advance of the “big freeze”), and 2) increased procurement of ancillary services to ensure the “reserve margin” (the difference between expected demand and available supply, or the grid operator’s margin for error to avoid blackouts) was as close to its officially stated minimum target1 of 13.75% as possible.
While it is always uncomfortably warm and humid in Texas from June to September, average monthly temperatures during the summer of 2021 (as measured in Dallas and Houston) were actually at or below the 10-year averages for the most part, with a few exceptions – the month of September in both cities as well as August in Houston. Figure 1 below shows these weather details by city.
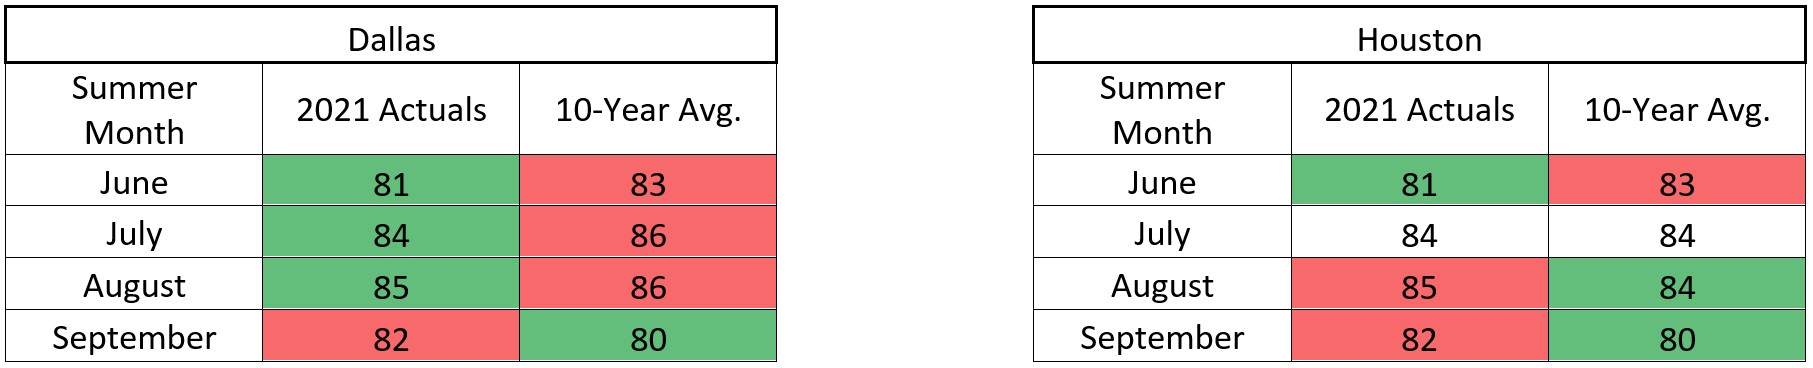
Figure 1: Summer Average Temperatures for Dallas and Houston from 5
Also, throughout the summer months, the spot electricity market (also known as the real-time index) as measured at the ERCOT North Trade Hub (the most liquid trading point in the state) averaged $38.99/MWh (or 3.90 cents/kWh). There was certainly some volatility in the market (see Figure 2 below), particularly during a heatwave in mid-June. But there were less than 20 times when the 15-minute interval spot price for power “blew out” above $1,000/MWh all summer. Compared to summers like 2011 and 2019, volatility was mild. Few of our clients had exposure to spot prices during this summer and, those that did were intentionally floating for specific reasons or unique circumstances. Nonetheless, this market is an excellent proxy for the instantaneous supply/demand balance on the power grid. When we see spot prices escalate, that indicates that either supply or demand is out of balance relative to the other for a short period of time.
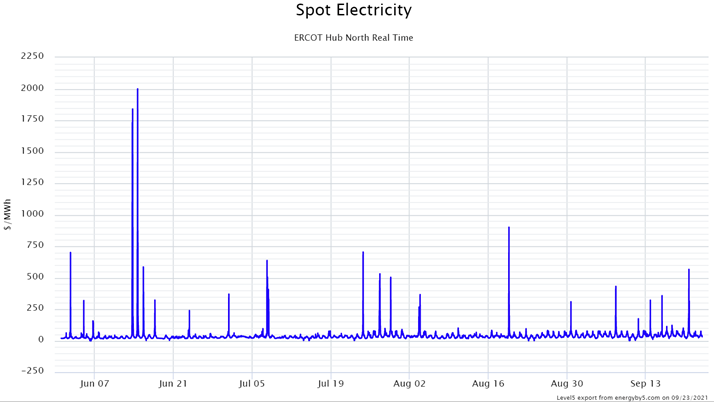
Figure 2: Spot Electricity ERCOT Hub North from 5
During the summer months, the team at 5 puts in a great deal of effort around load forecasting. In ERCOT, forecasting the 4 Coincident Peak (“4CP”) date/time intervals (i.e., when the grid achieves peak demand for each of the 4-summer months) seems to get more and more challenging each year. As a reminder, 4CP forecasting is a critical energy management technique (and a complimentary service we provide to our clients) because it determines what end-users pay to their transmission and distribution service providers (TDSPs) for transmission service in the following calendar year. This charge can be the largest line item on the delivery side of the invoice for many commercial and industrial clients.
It is becoming more challenging to predict 4CP as many more end-users now proactively manage this line item by reducing electricity consumption during periods of peak demand. In the summer of 2021, we observed close to 2,000 MWs of “flexible load” participate in 4CP curtailments. The impact of this amount of participation for load forecasters (including 5) is that the hottest day of the month is not necessarily the day when the 4CP occurs. With many end-users curtailing in the afternoon hours on the hottest day, the grid-wide energy demand actually flattens out around 2:00 PM or 3:00 PM. The 4CP, then, could easily occur on a day of the month that is less obvious to market participants. Air temperatures, humidity levels, and cloud cover over big cities are no longer the solid indicators for forecasting 4CP intervals. The month of June was a great example of this where many load forecasters did not make the correct call. Figure 3 below provides a recap of the 2021 4CP intervals in ERCOT:
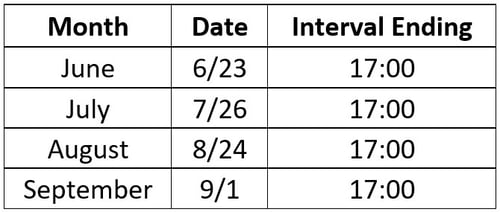
Figure 3: Recap of the 2021 4CP Intervals in ERCOT from 5
For many of our clients, managing their 4CPs is a great way to enter the Demand Response market. 4CP management is a form of “economic demand response”. When clients realize that voluntarily reducing electricity consumption for a few hours on a couple of days in the summer might not be disruptive to their operations or their people, they are more inclined to pursue opportunities in the “emergency demand response” markets as well.
Another form of “economic demand response” (and another big trend worth noting from this summer) are programs designed and implemented by retail electricity providers (REPs). Several, but not all, REPs in the Texas market have rolled out their own forms of “supplier-dispatched” demand response programs, providing clients with meaningful financial benefit. Our team of experts would love to help you determine if you have a flexible load and which of the many economic demand response programs may be right for your business.
Lastly, the elephant in the room this summer (and something we have been writing about extensively in our NYMEX posts for several months) is the runaway US natural gas market and how it is affecting electricity futures in ERCOT. There are numerous forces pushing up gas prices, including more LNG exports, a post-winter storm hangover in the energy markets, aggressive moves by many traders to never be short again, and the general inflationary environment as we emerge from the COVID-19 pandemic. But the result is simple, higher electricity prices for Texans.
Higher prices are not on the way - they are already here. If your current electricity contract is set to expire in 2021 or 2022, you are likely to experience some serious sticker shock, and a subsequent hit to your budget. Figure 4 below shows the bullish nature of ERCOT’s forward power curve since June 1, 2021. There are several techniques to use when buying into a bull market. Call your 5 energy advisor to learn more about these strategies and how they can help you and your business.
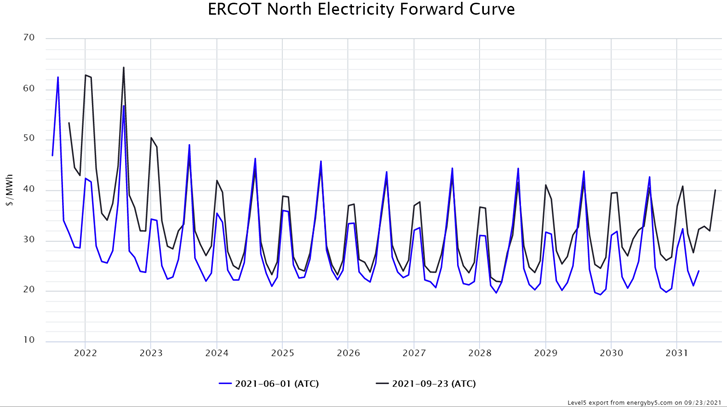
Figure 4: ERCOT North Electricity Forward Curve from 5
1 http://www.ercot.com/gridinfo/resource