
One might expect significant variations in price movements in an electricity market that spans half the continental United States, from Chicago to New Jersey. However, there is a remarkable degree of consistency in spot (index) prices and in the forward electricity curves across the PJM Interconnection (PJM).
At the western edge of PJM, spot prices in 2020 have continued to settle below historical index prices over the last six years. Figure 1 shows the monthly spot settlement price in Chicago/Com from 2014 through the first seven months of 2020. Note that the highest index settlement prices were in calendar year 2014 (blue line), when the Polar Vortex came across the Northeast and Midwestern parts of the country. So far, calendar year 2020 (purple line) has settled below all other years since 2014. Demand destruction due to the coronavirus and a relatively mild winter is likely the cause of the distinct separation between prices from March through May in 2020 compared to other years.
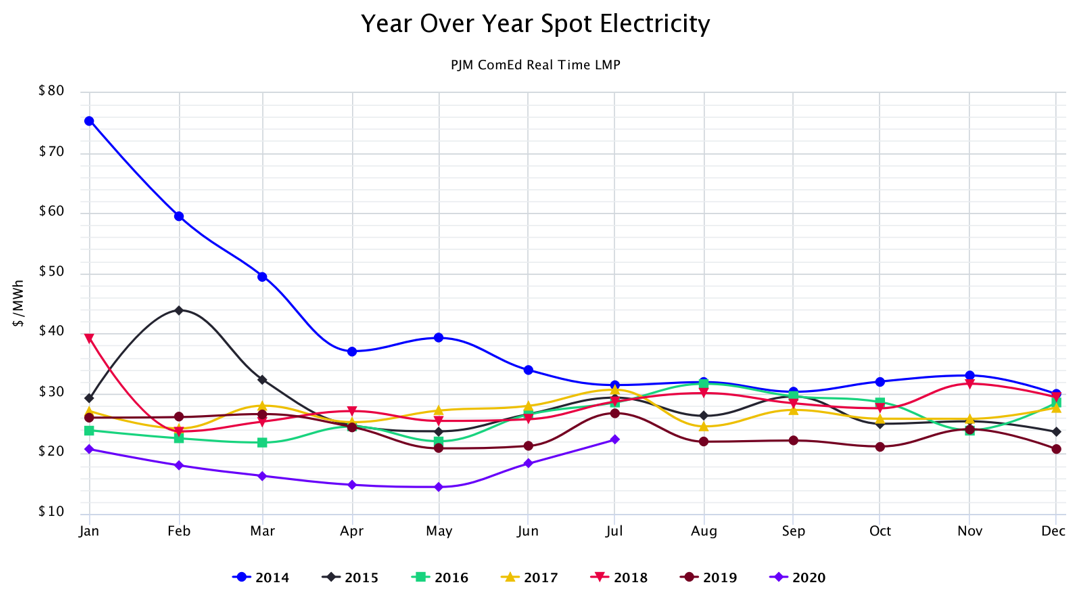
Figure 1: Year Over Year Spot Electricity PJM ComEd Real-Time LMP, by 5
Futures prices are remarkably flat out to calendar year 2025. Figure 2 shows the 48-month forward wholesale trading ranges at the Chicago/Com Ed trading hub. The height of the green bar shows the 4-year range of low and high prices for gas in the calendar years shown on the x-axis. The black bar shows where prices are trading as of 7/27/20. This chart shows that wholesale electricity prices for calendar years 2021 through 2025 are near the bottom quartile of the four-year historical trading range with a difference of only $1.12 per MWh between the current prices for the highest priced year (2021 at $24.10) and the lowest priced year (2023 at $22.98). These are good purchasing signals for clients that are seeking budget stability for next several years.
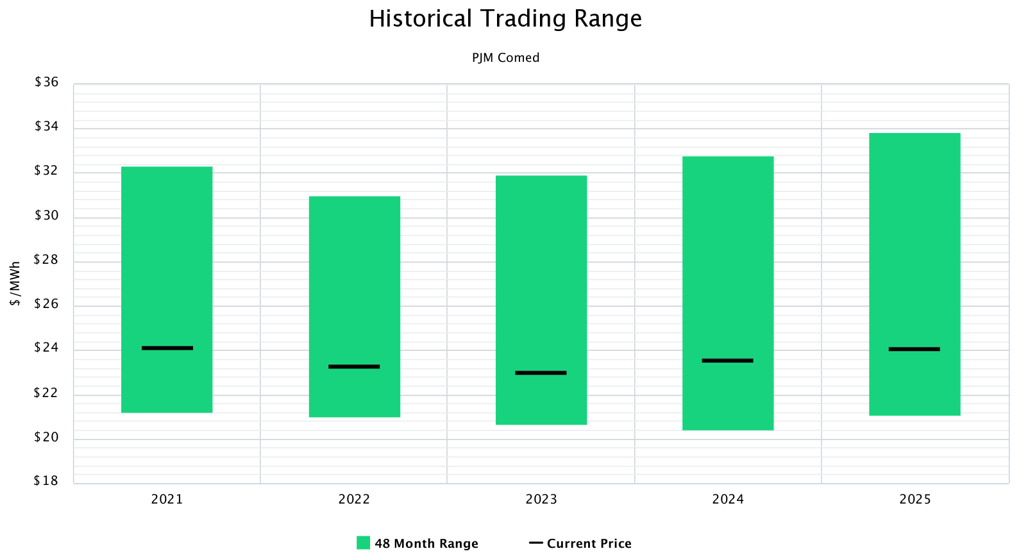
Figure 2: Historical Trading Range PJM ComEd, by 5
The trends in the eastern part of PJM are very similar to observations in Chicago. Figure 3 is similar to Figure 1 and shows the monthly spot settlement price at the PJM East (Eastern PA & New Jersey) trading hub from 2014 through the first half of 2020. While the trends are similar, the price differences are significant.
In January 2014, prices at the PJM East hub settled at nearly $146.61/MWh, while in Com Ed prices settled at $75.37/MWh. As in the western part of PJM, spot prices for the first half of 2020 (purple line) have also settled below all other years.
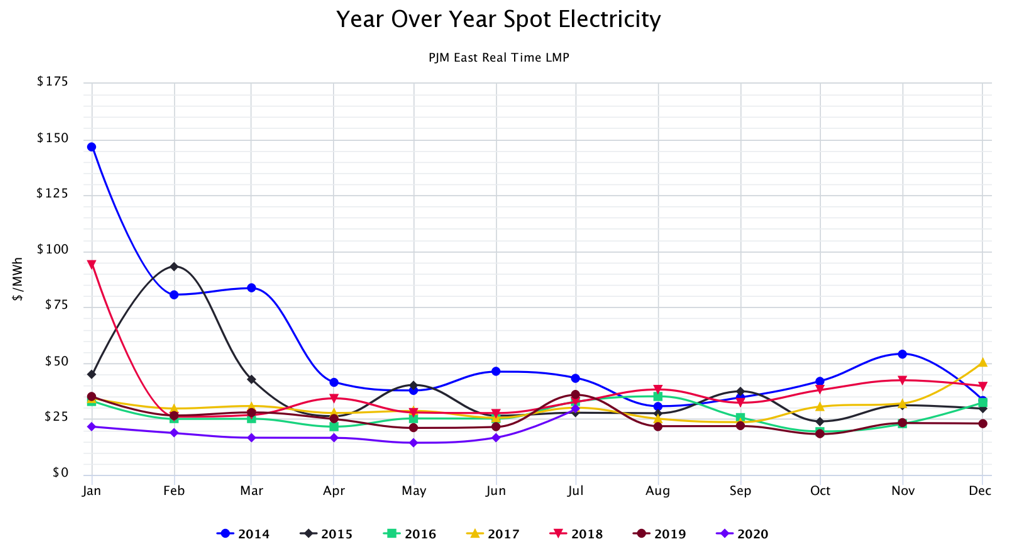
Figure 3: Year Over Year Spot Electricity PJM East Real-Time LMP, by 5
Futures prices in PJM East are also relatively flat out to calendar year 2025. Figure 4 is similar to Figure 2 and shows the 48-month forward wholesale trading ranges at the PJM East trading hub as of 7/27/20. This chart shows a small discount in wholesale electricity from 2021 to 2023 and slight premium in calendar years 2024 and 2025. Overall, however, there is little difference between the lowest priced year (2023 at $27.10) and the highest priced year (2025 at $28.72). These are also good purchasing signals for clients that are seeking budget stability for next several years.
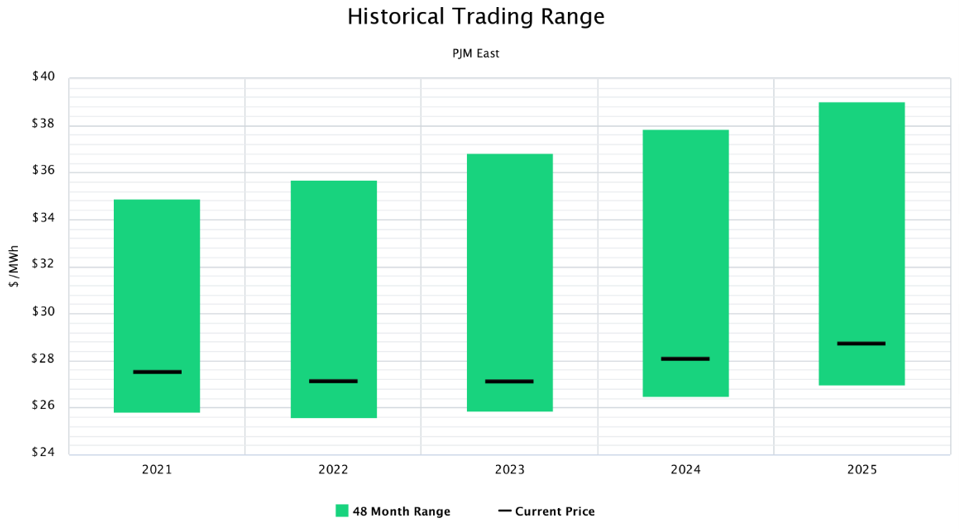
Figure 4: Historical Trading Range PJM East, by 5