
On behalf of the team at 5, I am pleased to forward our market letter for the third quarter of 2016. Before turning to our discussion of general market developments, I’d like to highlight an important trend shown in our technical energy charts. Our market guru, Eric Plateis, built proprietary analytical tools to forecast the future direction of electricity and natural gas prices. Below is Eric’s chart of the Henry Hub rolling prompt month price of natural gas (the next month in the year) from late July to today.
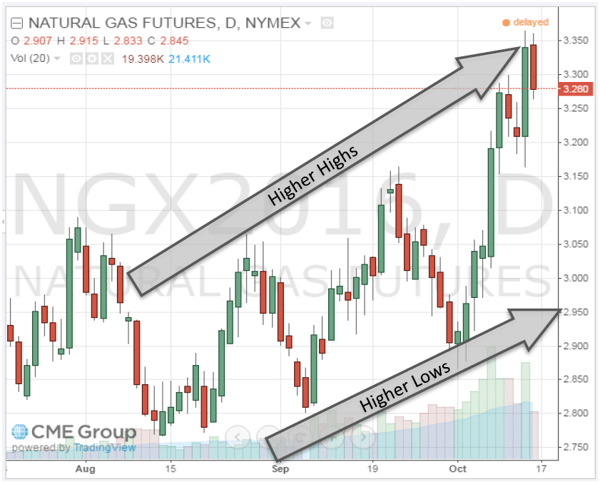
You can see that the typical range bound trading (recent range of 25¢ to 30¢/MMBtu) has held constant since mid-August, but instead of just being inside a single range, the range has a positive slope. The typical cycle or wave from low to low has been about 2 to 3 weeks long, and each cycle’s low and high are higher than the previous cycle. In fact, each cycle’s new higher high and higher low were around 10¢ higher than the previous cycle’s maximum and minimum, until this week. Last week’s upswing had a 40¢ move up, and if this is the end of this upswing, the length of the up cycle shortened slightly. Today the market is trading around $3.24/MMBtu, right around 11¢/MMBtu higher than the previous cycle’s high of about $3.13/MMBtu.
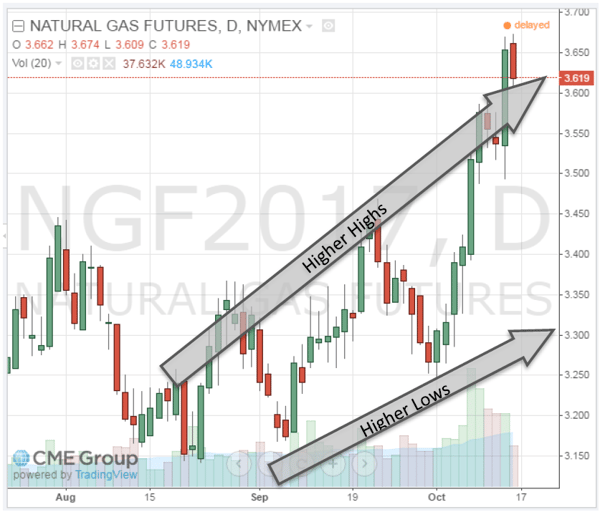
The future price chart is similar. The graph below describes how the January 2017 price of natural gas has traded from late July to the present. Again, we see a series of successive market highs and market lows. The key difference between the January 2017 chart, and the prompt month chart, is the slope of the line. In this case, the price is rising even more quickly than in the prompt month.
These technical charts indicate that the bearish market in natural gas may be coming to an end. We continue to urge clients with open gas and power positions consider opportunities to limit their exposure to rising natural gas and electricity prices.
Developments in Renewable Power
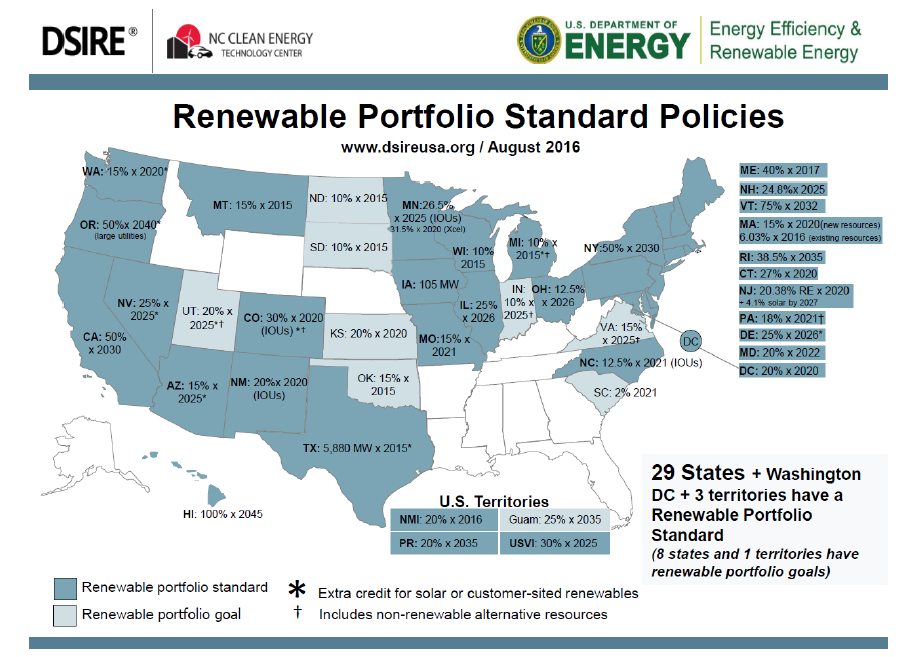
In the renewable energy market, I am reminded of the saying, “Think globally, act locally.” While there are many national and international trends impacting renewable markets, the key drivers in the United States are local laws and regulations. The map below demonstrates the extent to which various states have implemented regulations supporting renewable power. As noted on the map, 29 states and the District of Columbia have implemented renewable portfolio standards. Renewable portfolio standards essentially require any supplier of an end use customer to include a specified percentage of renewable power into any kilowatts that they serve. Therefore, these standards apply to all customers regardless of whether you want to purchase renewable power or not.
The District of Columbia provides a good example of the significant opportunities created by local legislation. On July 25, 2016, the DC Government passed an amendment to the District’s Renewable Energy Portfolio Standard Act (the “July Act”). The Renewable Act requires all electricity suppliers to procure a set percentage of solar Renewable Energy Credits or RECs for each customer they serve in DC. If they cannot purchase solar RECs generated in DC, they are required to make an alternative compliance payment to DC. Since there is very little solar power produced in DC, electricity suppliers will likely include in their retail price the alternative compliance cost. The July Act significantly increased the alternative compliance cost. In so doing, it significantly increased the cost of electricity from any generation source for all consumers in the District of Columbia.
Significantly, the July Act contains a grandfathering provision. This clause allows customers that execute contracts prior to the effective date of the July Act to avoid these increased costs for 5 years. The chart at the top of the following page shows the changes made by the DC law and the incremental cost of such changes during the first 5 years of the new law.
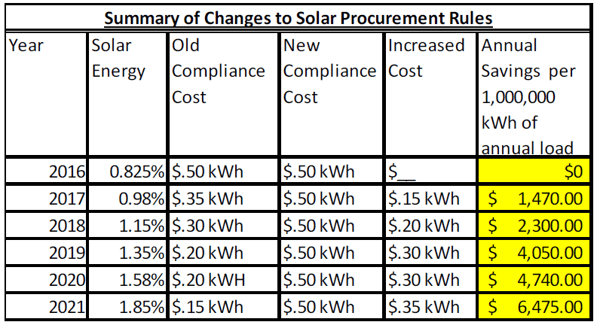
After the July Act was passed, 5 saved clients a significant amount of money by working with them to execute new contracts that locked in the old compliance costs prior to the July Act’s effective date of October 8, 2016.
While clients can no longer take advantage of the grandfathering provision, the new regulations present another opportunity: they significantly increase the value of on-site solar projects. The DC wholesale market price of electricity is approximately $40 MWh. The alternative compliance cost is $500 MWh through 2023. 1 A solar owner is effectively paid the energy price (~$40 MWh) plus the SREC price ($350-$500 MWh) for each MWh produced by an on-site solar system. A 50,000 sq. ft. roof can generally support a 500 kW system. If we assume this system generated solar power 15% of the time, it would generate solar energy 1,314 hours of the year (8,760 hours * 0.15 = 1,314), and it would generate 657,000 kWh (1,314 * 500) or 657 MWhs of electricity. At $400 a MWh, this equals $262,800 in revenue in year 1 of operations. You get the idea. When you add in various tax incentives, the numbers get even better. We recently looked at a rooftop project for a DC client that had a 2-year ROI (return on investment) and a 32% IRR.
The DC example underscores the local nature of the renewable market. While the economics of on-site solar in DC are fantastic, they are challenging in Texas. Texas has more space, more sunlight and lower labor costs than DC, yet for commercial and industrial customers, an on-site solar system in Texas may have more challenging economics and needs to be looked at more carefully. Clients with operations in multiple jurisdictions, must (i) follow each market to identify the renewable opportunities with the best economics, and (ii) move quickly to take advantage of such opportunities before future changes in regulatory rules and/or market prices erode the value of such projects.
Corporate PPAs
Corporate power purchase agreements or PPAs are another significant driver of large scale renewable energy generation facilities. In 2013, 500 MWs of power contracts were signed directly between renewable power plants and end use retail customers. This volume increased to 1,100 MWs in 2014 and 3,200 MWs in 2015. Commentators expect that the number and volume of such deals will continue to increase dramatically in 2016. In fact, 44% of the Fortune 500 have made specific carbon and/or renewable energy targets. We continue to see growing interest in PPAs negotiated between large consumers and a renewable power plant, most often wind or solar projects.
It is important to note that these are very complex transactions. A renewable PPA includes a wide variety of costs and risks that may not always be fully appreciated by the corporate buyers. Google’s PPA with a wind farm in Story County, Iowa is a good example of what often takes place in these transactions. As diagrammed at right, the wind farm generates two distinct products: 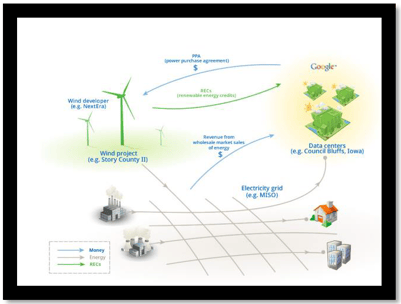
The first is electricity. The electrons are measured at a meter at the wind farm and then transmitted over power lines to the local electricity grid. Since all electrons look alike, the market treats a wind generated electron the same as a coal, gas or hydro generated electron. There is no way to label the electron. The market uses renewable energy certificates, or RECs, to distinguish an electron generated from a renewable resource. Each REC represents a single MWh of renewable generation. If the wind farm generates 10,000 MWhs in a year, it is “credited” with generating 10,000 RECs. The wind farm can then sell these RECs in the market. Each REC needs to be tracked so that the wind farm cannot sell more or less RECs than it generates. Unlike electrons, RECs do not need to travel over transmission lines. Instead, an agency (for example, the US Department of Energy’s Green Power Network) certifies that the REC was created and retired. As a result, a consumer in Florida can easily purchase a REC generated by a wind farm in West Texas.
When a corporation enters into a PPA with an offsite wind farm or solar facility, it does not take “delivery” of the electrons. The purchaser (in this case, Google) pays a price for both the electrons and the RECs. While it takes delivery of the RECs, the electrons are transmitted onto the local grid. Google is paid the wholesale market price for these electrons. At the same time, it must purchase the electrons used by its data center. If the price that Google pays for the electrons taken off the grid is lower than the market price it receives for selling the electrons generated by the wind farm, it will reduce its electricity cost. If the price that Google pays for the electrons is higher than the PPA price, it will be paying an additional cost.
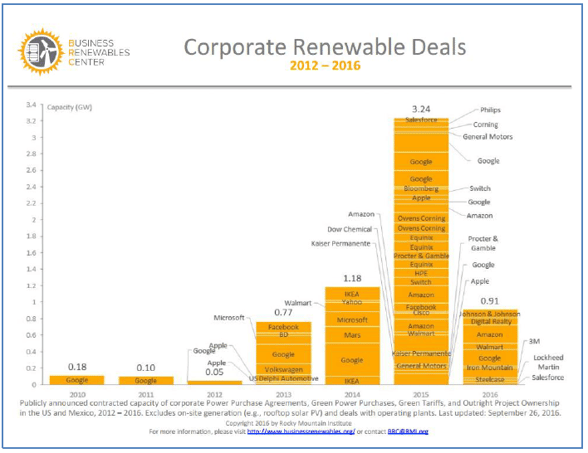 There are a host of other economic, legal and regulatory issues that must be addressed when negotiating a corporate PPA. The corporate buyer must correctly model and allocate these risks, for example, the price paid for electrons sold onto the grid at Story County may be very different from the price paid for electrons at Council Bluffs. In addition, the documentation is complex and expensive. It can take many months and even years to negotiate the various agreements necessary for a corporate buyer to transact directly with a wind or solar farm. But even with these challenges, more and more transactions are taking place. The chart to the left summarizes some of the more important renewable transactions closed over the past few years.
Clean Power Plan Update
Even as the Fortune 500 move to purchase renewable power, President Obama’s signature environmental action, the Clean Power Plan, or CPP, remains mired in litigation. Multiple states sued the EPA in the fall of 2015 to block implementation of the CPP. In February 2016, in a surprising order, the Supreme Court blocked implementation of the CPP (voting 5-4, with one of the votes in favor of the stay being that of the late Justice Scalia). As expected, the liberal justices appeared to be more sympathetic to the EPA’s authority, the conservative justices more skeptical. The Supreme Court sent the argument back to the DC Circuit which, sitting before the full Court of Appeals, heard oral arguments on the various legal issues on September 27, 2017. Since the Supreme Court now has only 8 justices, based on the voting in the February ruling, they are likely to split 4/4 when the case comes back for further review. For this reason, the final decision appears to rest on the vote of the 9th justice. If Clinton is elected, it is most likely that the court rules in favor of the CPP. If Trump is elected, I expect that the CPP will be defeated.
Mexico
The Mexican power market continues its steady march towards deregulation. The benefits of competition and the dramatic drop in the price of solar and wind power were both demonstrated in two recent auctions held by the country’s energy regulators. In the first auction, conducted last spring, energy supply contracts were awarded for 1,700 MWs of renewable energy generation. The majority of the winning bids were from solar projects; the average price of the winning bids a surprisingly low $45.15 MWh. A wide variety of international companies won bids including Enel, Vega Solar, JinkoSolar, Recurrent Energy and SunPower. A second round of contracts were awarded in October. A total of 2,871 MWs of power contracts were awarded to 23 bidders at an average price of $33.47 MWh, some 30% lower than the bids this past spring. As with the first auction, international solar and wind developers dominated the bidding. Second round winning bidders included Enel, Engie, EDF, Iberdrola, IEnnova, and X-Elio. While the market is still in its early stages, the recent auction results in Mexico demonstrate two things. First, competition among solar and wind developers continues to drive down the price of renewable energy. Second, Mexico is very serious about deregulation. We continue to actively follow the Mexican energy market and our team is available to answer questions you may have about this market.
1 The compliance cost is $400 MWh from 2024-2028, $300 MWh from 2029-2032, and $50 MWh in 2033 and thereafter.