On behalf of the team at 5, I am pleased to forward our market letter for the third quarter of 2021. World leaders convened in Glasgow on October 31st to address international commitments to lower greenhouse gas emissions. The energy market welcomed these delegates with a complex set of conditions that frame the challenge posed by the transition to a clean energy economy. These include historically high natural gas prices and significant energy shortages in several markets that moved aggressively to decarbonize their electricity grids: UK, Germany, and California. At the same time, energy shortages in China may undercut decarbonization efforts of the world’s largest carbon emitter.
It is relatively easy to disassemble the old energy markets, shut down nuclear plants, stop fracking, cancel pipelines, and provide tax incentives for wind and solar generation. It is also easy to adopt policies that increase electricity usage. Limits to natural gas usage, halting natural gas pipelines, and tax incentives for EV vehicles all put additional demand on the electricity grid. Unfortunately, many policy decisions are being made before a reliable low-carbon electricity grid has been established. As we have noted in earlier letters, it is one thing to build a large solar farm in Western New York; it is quite another to run a transmission line from that solar farm to consumers in New York City. The balance of this letter discusses these challenges and the risks they could impose on energy consumers.
Backdrop: Worldwide Increase in Commodity Prices
In the United States and in other markets, the shift from high carbon fuels (coal and oil) to natural gas is key to the energy transition. As shown in Figure 1, natural gas usage has increased significantly over the past twenty years or so.
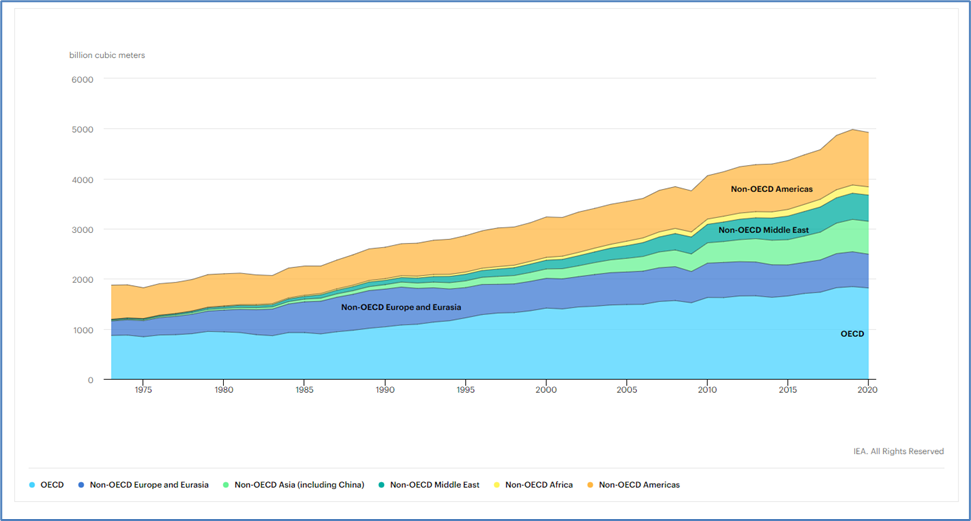
Figure 1: World Natural Gas Demand by Region, 1973-2020 from iea.org
The reliance on natural gas is not without risk. The price of natural gas in the US (Henry Hub) spiked in Q3, but that increase is minor compared to what has happened to the price of natural gas in Europe and Asia. Figure 2 shows that Liquefied Natural Gas (LNG) prices hit record highs in Asia and Europe during early October, an incredible 20x increase from prices during the Covid summer of 2020.

Figure 2: Daily Crude Oil, Natural Gas, and LNG Spot Prices (Jan 2018 - Oct 2021) from eia.gov
Increased demand for natural gas to meet carbon goals was not the primary cause for the price spike, but overall demand was probably a contributing factor. More direct reasons for the spike include a decline in the European production of natural gas, a decrease in natural gas exports to Europe from Russia, increased demand for natural gas in Asia which is now competing with Europe for limited imports, and increased demand in Brazil as gas is needed to offset reduced hydro production, a result of a 90-year drought.
Perhaps as important as the price increase, for US consumers, a key change in the market is that US natural gas is now correlated to worldwide prices. Until now, the price of natural gas in the US was disconnected from non-US markets. Since we had abundant supply and limited pipelines and LNG terminals to export natural gas, the price was a function of US supply and demand. With more and more LNG export facilities (and reduced supply), US natural gas prices have started to move with the price of natural gas in Europe and Asia. This creates a significant new risk to be managed by US buyers.
England and Germany: Energy Shortages and Price Spikes
Frozen wind turbines during Winter Storm Uri contributed to Texas’ energy shortage. This fall’s abnormal weather, in this case, a lack of offshore wind, once again helped drive electricity shortages in the UK and Germany. The UK depends on offshore wind for energy supply and to meet its commitment to be carbon neutral by 2050. But in early September, the offshore wind farms generated only 11% of the UK’s demand vs the 18%-20% that was expected. For example, on September 6, 2021, wind provided only 2.5% of the UK’s electricity.
Figure 3 highlights the lack of wind across much of Europe in September.
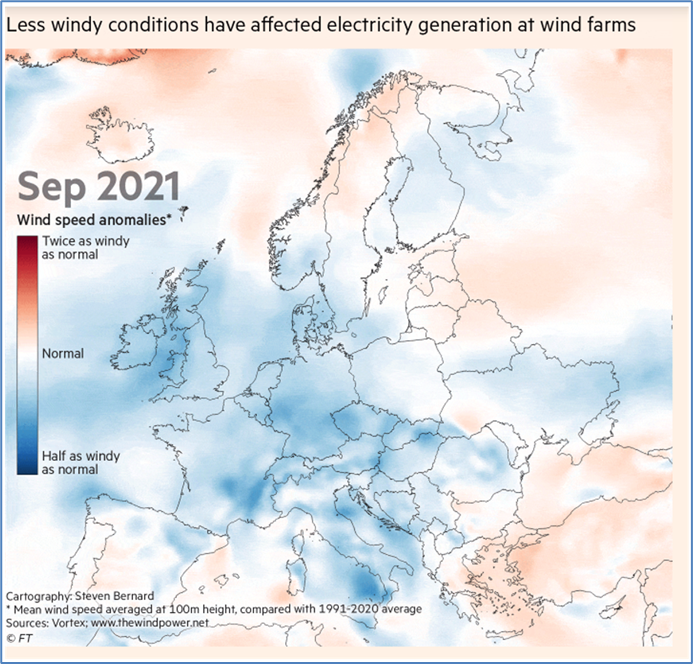
Figure 3: September 2021 Wind Speed Anomalies from ft.com
Even before the wind decided to stop blowing, natural gas prices and electricity were already trading at high levels, boosted by post-pandemic demand, a lack of natural gas in the UK and European storage facilities, and greater demand for natural gas in the US and Asia.
As a result, and as Figure 4 demonstrates, the price of electricity and natural gas hit all-time highs in the UK and rallied in Germany.
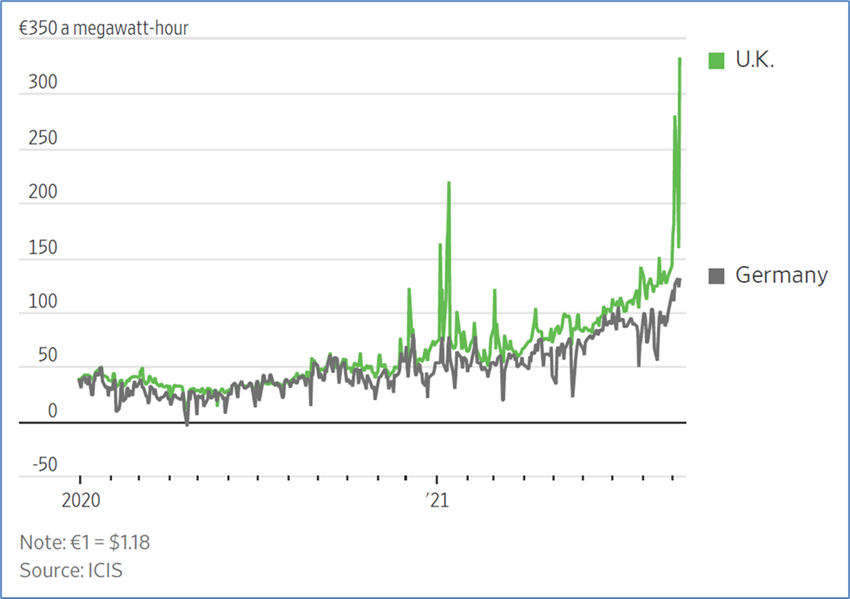
Figure 4: Wholesale Day-Ahead Power Prices Since 2019 from wsj.com
The resulting high price of electricity and natural gas forced factories to stop manufacturing and led to the failure of some 18 energy suppliers in the UK. These suppliers had offered to supply their electricity clients with fixed-price electricity and had not adequately hedged these commitments. Faced with the risk of an energy shortage, the UK had to fire up its last remaining coal-fired plants just to keep the lights on. If this trend continues, the UK will also have a hard time meeting its pledge to have a carbon-neutral energy grid by 2035.
Germany, faced with a similar crisis, needed old coal power plants to fill the gap left by low wind output and the closure of nuclear plants. Higher amounts of coal used for fuel in Germany (See Figure 5) caused the biggest jump in greenhouse emissions in 30 years.
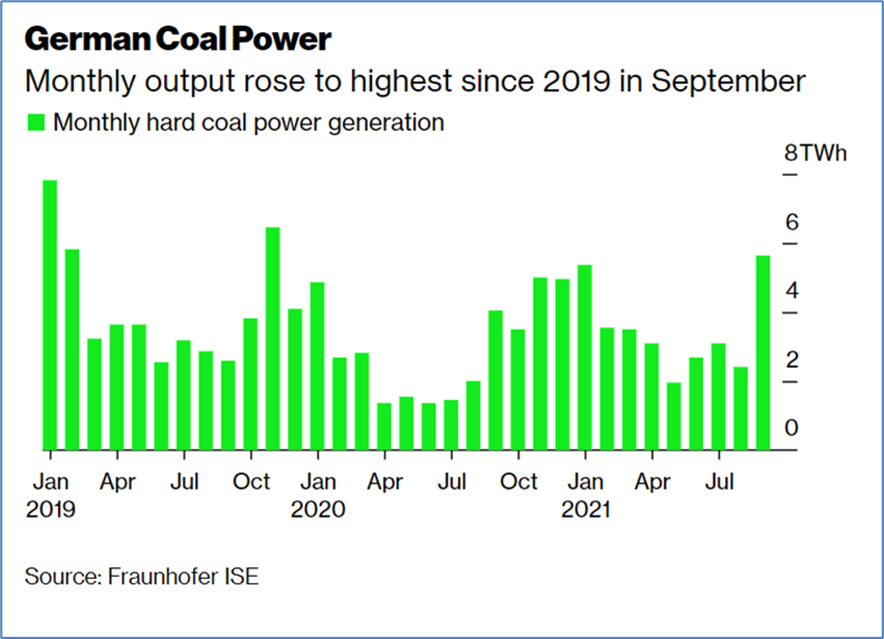
Figure 5: Monthly Output Rose to Highest Since September 2019 from bloomberg.com
Low wind speeds are not the only culprit. The UK and Germany’s move away from fossil fuels is also partially to blame. In both markets, wind and other renewables have taken significant market share away from coal plants (almost all of which have been retired), nuclear and natural gas-fired generation. As Figures 6 and 7 demonstrate, the UK and Germany have successfully reduced their amounts of coal and nuclear generation. After this spike in natural gas pricing and facing a real risk of an energy shortage, energy regulators may wish that these coal and nuclear plants were still available as a last resort.
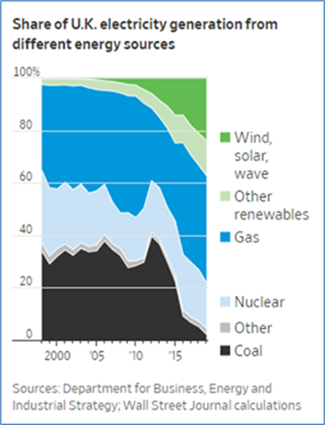
Figure 6: Share of UK Electricity Generation from Different Energy Sources from wsj.com
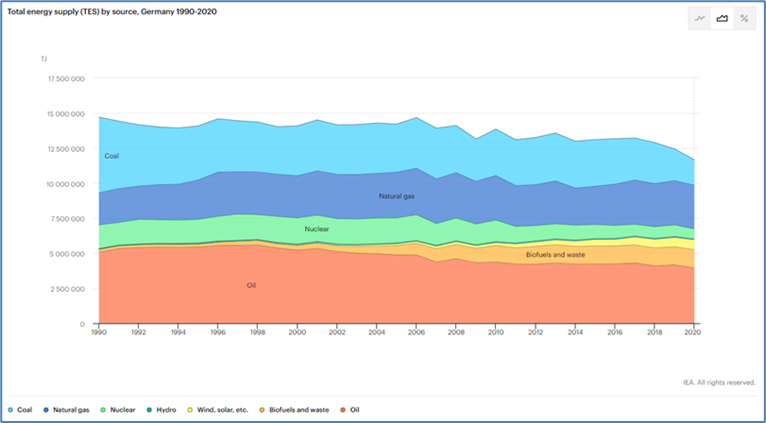
Figure 7: Total Energy Supply (TES) by Source, Germany 1990 - 2020 from iea.org
Political risk is another reason that European countries may now reconsider their decision to retire coal and nuclear generation. The shortage of natural gas played into the hands of the region’s largest exporter, Russia, which has been limiting natural gas exports. This may be in part to secure permits needed for a large gas pipeline being built in the North Sea. When Russia expands exports, the price of natural gas drops, when Russia withholds exports, prices rise. In Germany, the Russian connection is even more problematic. Russia owns a large amount of natural gas storage sites in Germany. According to a recent Bloomberg report and as shown in Figure 8, Germany’s gas storage was 71% full on Oct. 27th, while sites controlled by Russia (via Gazprom) were just 21% full.
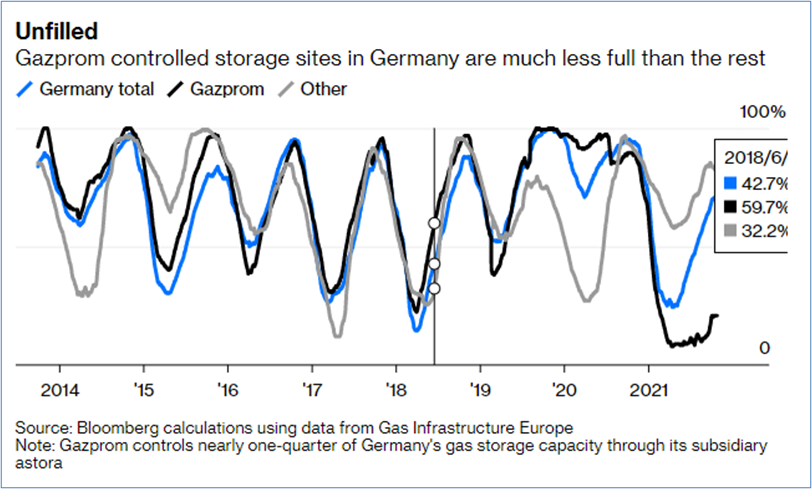
Figure 8: Gazprom Controlled Storage Site in Germany from bloomberg.com
California: Running Dirty Natural Gas Plants
California shares many of the problems faced by the UK and Germany. California’s SB 100 established the state’s goal to have a carbon-free electricity grid by 2045. To do this, regulators have required the state’s utilities to purchase a massive amount of renewable energy and battery storage. Today, California gets over 20% of its electricity from solar generation and another 7% from wind. At the same time, the state is pushing to retire its last nuclear plant, Diablo Canyon (which generates some 10% of the state’s electricity) by 2025. California’s transition to becoming a carbon-free grid has strained its electricity grid. This is one of the reasons why California has the nation’s highest electricity prices and struggles to keep the lights on.
Faced with the risk of more power shortages, California has had to rethink closing its old natural gas plants. For example, AES Redondo Beach, scheduled to retire at the end of 2020, had its operating life extended in October through 2023. This is a repeat of last year when California extended operational permits to three other relatively inefficient natural gas generators in the face of supply shortages. If California is watching events in the UK and Germany, they may also want to reconsider the decision to shut down Diablo Canyon.
The risk of shortages, however, has not stopped California from taking new steps that should put further pressure on the energy system. For example, California just adopted new building codes to incentivize all-electric construction and Los Angeles set 2035 as its target for having a carbon-free electricity sector.
China: Halting then Re-Starting Coal Plants
In our Q2 letter, we pointed to China’s state planning power and ability to permit and build long-term transmission lines as a competitive advantage over the US’s mixed federal and state energy market regulations. For sure, China has the ability to get things done quickly. But in Q3, we saw that China’s effort to decarbonize its electricity grid is not without risk. In September, power shortages and blackouts spread throughout China – with at least 18 provinces curbing electricity use.
Energy cuts were severe and continue to hamper industrial production. The energy shortage can be traced, in part, to China’s efforts to meet its own carbon reduction targets in advance of COP26 and the Winter Olympics in Beijing next February. Almost half of China’s regions missed energy reduction targets and were being pressured to reduce energy consumption. At the same time, China mismanaged the energy market, allowing coal prices to float while fixing electricity prices paid to coal power plant owners. As the price of coal rose (in part due to China banning coal imports from Australia after Australia called for an investigation into the cause of Covid19), power plant operators stopped running as the price of electricity was not sufficient to cover the cost of the coal they needed to purchase.
With winter approaching, the Chinese government is taking all steps to increase coal production – ordering mines to operate at full capacity, importing coal from Australia, permitting new mines, and ordering coal producers to lower their prices. As in the UK and in Germany, when the grid is unable to reliably produce electricity, carbon reduction goals are set aside.
Conclusion: More Changes, More Unexpected Outcomes
While various grids are challenged by the changing nature of energy demand and supply, decisions continue to be taken that could increase both electricity demand and intermittent supply. Examples include the accelerated transition to EVs and regulations to promote electric heating of residential and commercial buildings. Further, if Biden’s infrastructure bill passes congress, another $550 billion will be focused on ways to accelerate the energy transition, such as extended tax credits for wind and solar developers. We should be clear, however, that the energy transition is not slowing down, and the risk of climate change is widely accepted. For example, at COP26, Bill Gates' Breakthrough Energy Catalyst announced a public-private partnership and committed $1 billion to help Europe meet its 2030 climate commitments. Interestingly, these funds are focused on new technologies needed to reach climate goals at a reasonable cost.
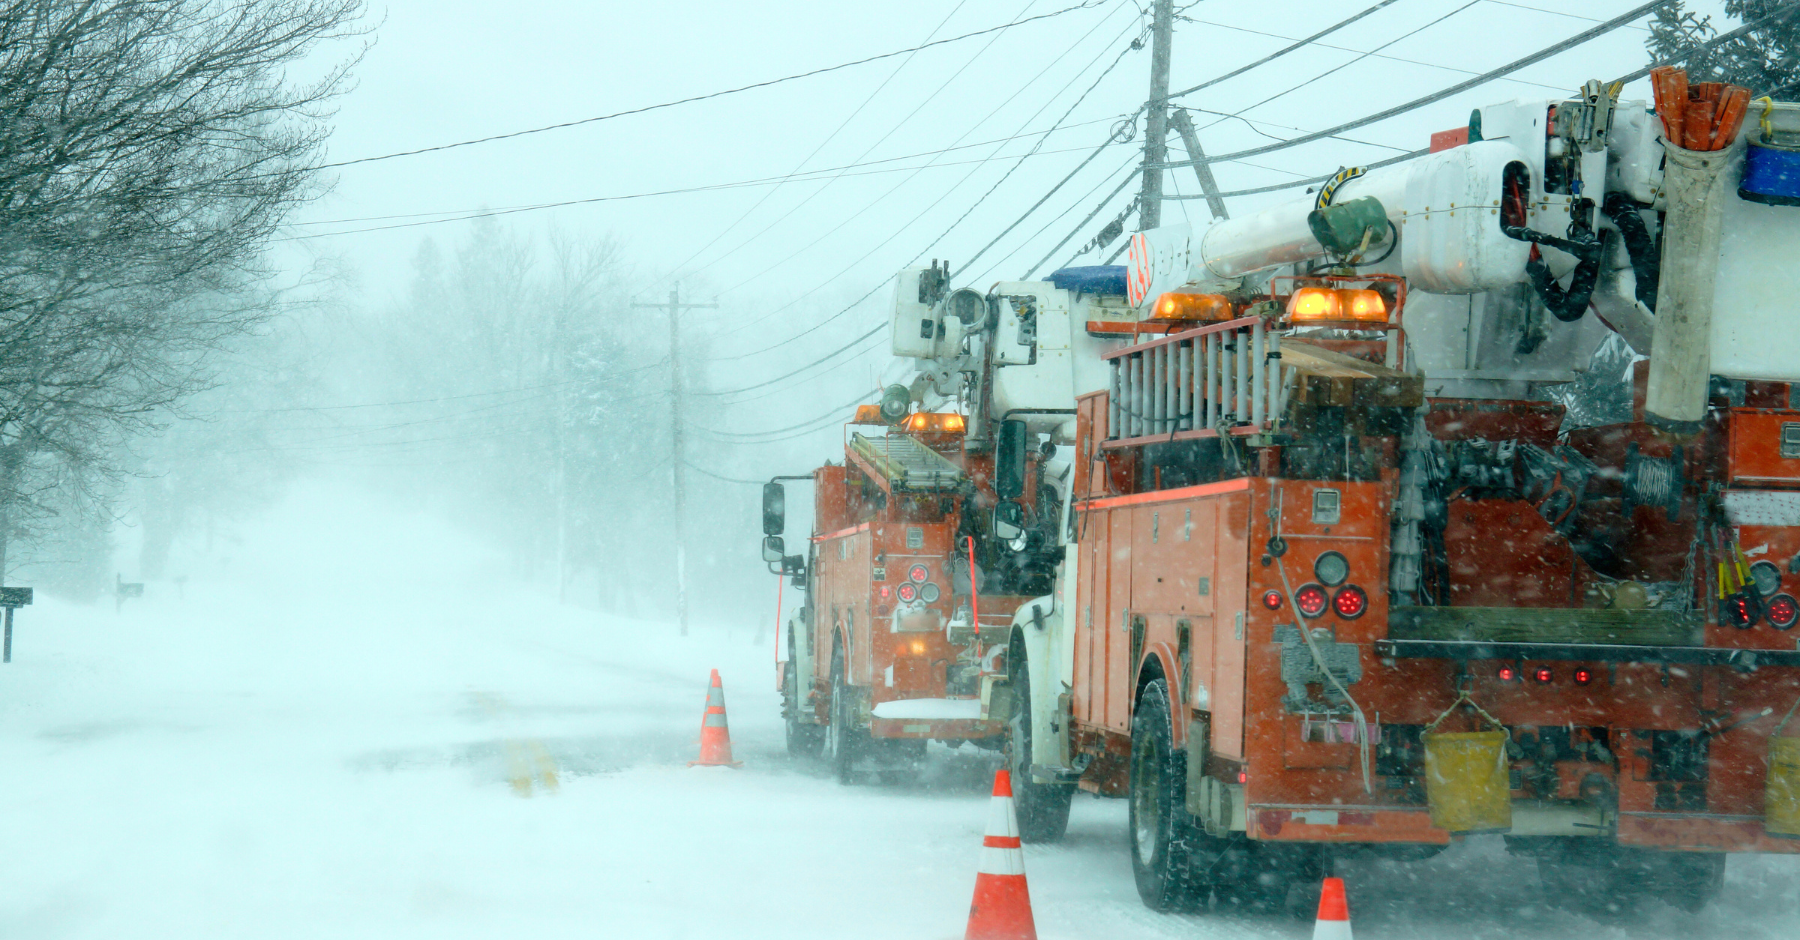
It is no surprise that whether due to extreme climate events or a less reliable energy grid, power outages are increasing and we expect this trend to continue. Figure 9 shows how climate-related disasters have affected the number of power outages throughout the US.
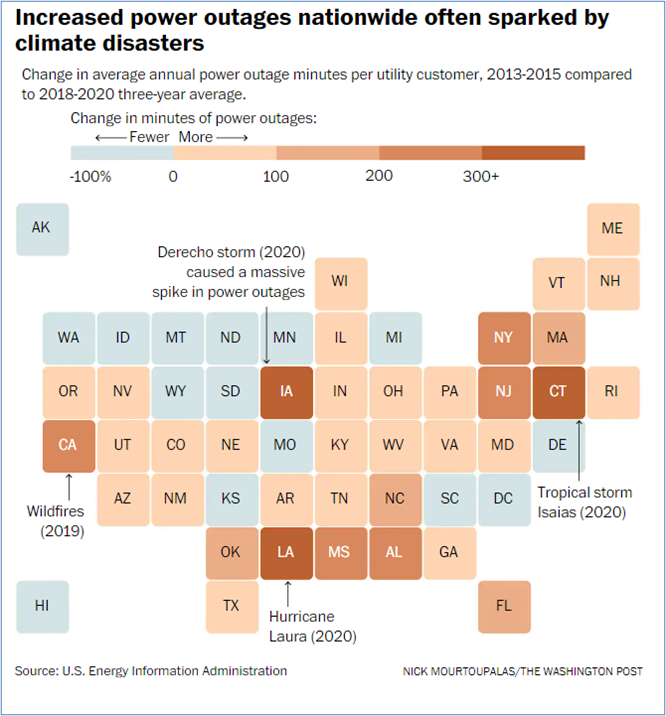
Figure 9: Increased Power Outages Nationwide Often Sparked by Climate Disasters from washingtonpost.com
Of course, the team at 5 is committed to helping our clients manage these transitions successfully. As always, please do not hesitate to contact me or other members of the 5 team if you have energy-related questions or you would like to discuss the issues covered in this letter in more detail.