NYMEX Henry Hub Natural Gas prices continue the strong rally that began in March with a persistent increase in prices extending all the way back to the onset of the pandemic at the beginning of 2020. Natural gas prices for the prompt month, balance of 2021, and future calendar years are all moving in the same direction. These sharp price increases can be seen in the NYMEX forward curves in Figure 1. And while all gas prices in all calendar years are on the rise, the strongest rally is in near-term prices over the next 18-months (see black, blue, and green lines in Figure 1).
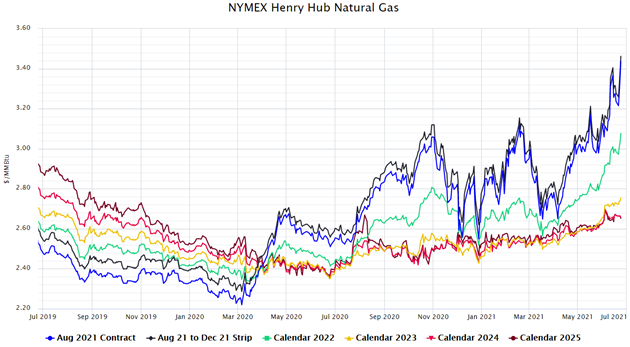
Figure 1: NYMEX Henry Hub Natural Gas from 5
Figure 2 shows how much the NYMEX natural gas forward curve has changed over the last three months. The black line shows the forward curve on June 25, while the blue line shows the same forward price curve on March 18. Notice how prices have increased across all calendar years to 2031, with the most dramatic price movement in the front end of the curve (calendar years 2022 and 2023).
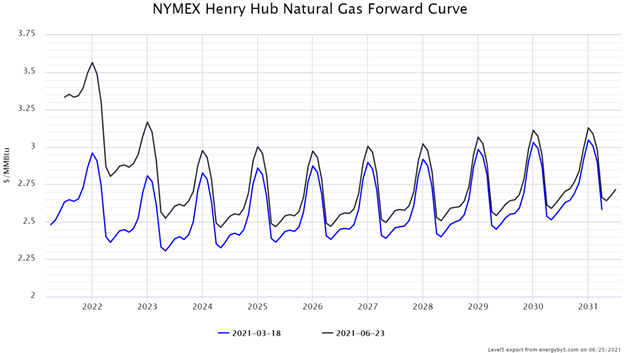
Figure 2: NYMEX Henry Hub Natural Gas Forward Curve from 5
What is driving this increase in natural gas prices? It may be convenient to blame this market rally on inflation as the price of many commodities has gone up over the last year. And while inflation may be a factor, it is only part of the story. The truth is that this bull market in natural gas can trace its origins back to trends and fundamentals that were in place even before the pandemic. US natural gas production hit its highest level in history (97 Bcf/day) in December 2019. Shortly after the onset of the pandemic, natural gas production slowed due to the economic recession that followed and adverse oilfield drilling economics that came with the economic contraction. Recall that the price of crude oil was actually negative on April 20, 2020. Today, natural gas production is robust and growing again, following the disastrous weather-induced production outages in February 2021.
Figure 3 shows the number of natural gas drilling rigs (blue line) relative to the amount of natural gas being produced each day in the United States. This data shows a steady recovery in rig count over the last year. The brown line shows that natural gas production rates remain strong even though the EIA’s Short-Term Energy Outlook doesn’t anticipate a return to pre-pandemic levels until 2023.
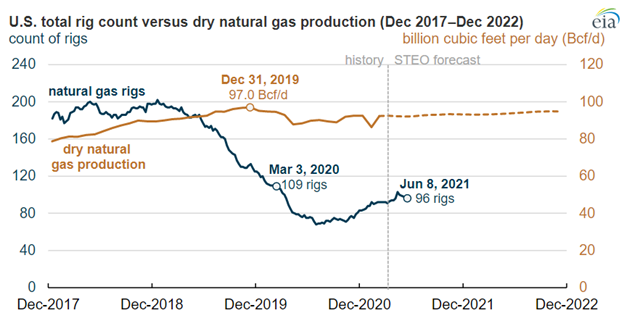
Figure 3: US Total Rig Count vs Dry Natural Gas Production from eia.gov
Another important factor to consider in evaluating the natural gas market is the amount of gas that is in storage. The US has a significant underground storage capacity. For the past few months, gas producers have been injecting gas into these storage facilities in preparation for next winter when demand for natural gas is high. As shown in Figure 4, current inventory levels (blue line) are within the 5-year range, but below the 5-year average (black line) and significantly below levels from a year ago. Only six months ago, natural gas storage levels were above the 5-year average but were drawn down significantly following winter storm Uri and the cold weather that gripped most of the country in February.
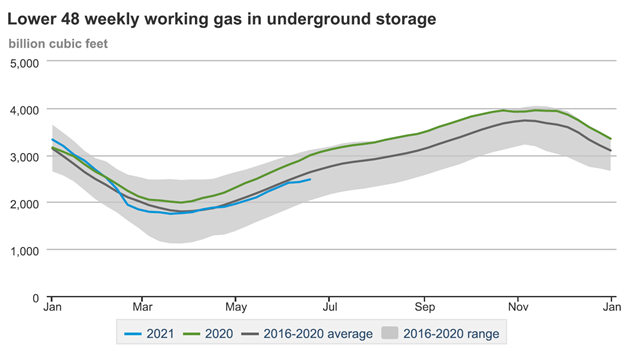
Figure 4: Lower 48 Weekly Working Gas in Underground Storage from eia.gov
Today, natural gas production is normal and the amount of natural gas in storage is slightly below normal. These factors alone are sufficient to explain the rapid increase in natural gas prices over the past 3 months. The other factors that need to be considered are near-term weather forecasts and the global demand for natural gas.
In the US, the summer is off to a warm start. Last week in Texas, ERCOT began issuing notices on June 13, warning of potential electricity shortages from high electricity demand and large amounts of air conditioning load which was expected to reach record levels. One market source reported that natural gas supplies needed for electricity generation demand in Texas averaged 5.8 billion cubic feet per day (Bcf/d) that week, more than 1.0 Bcf/d above the prior week. Locally, at the Houston Ship Channel gas hub, prices rose 18¢ from $3.01/MMBtu on June 9 to $3.19 on June 16. Gas prices at the Henry Hub also rose 7¢ from $3.10/MMBtu to $3.17/MMBtu over that same period. Severe weather and drought in the western US have also placed additional strain on the demand for natural gas due to lower output from many hydroelectric dams in that region. These weather-related factors have been a major driver behind this bull market that many do not expect to change in the near term.
Global demand for US natural gas is also accelerating. On June 17, the EIA reported that natural gas exports to Mexico increased 4.6% week-over-week to 6.8 Bcf/d, a new weekly average record. Incremental pipeline capacity continues to expand south of the border in the industrialized northern regions of Mexico where there is a high demand for US natural gas. Overseas markets in Asia and Europe are particularly hungry for natural gas. The global LNG market was thrown into disarray by the pandemic as the destruction of energy demand around the world led to severe supply imbalances in countries that depend on natural gas imports. During the pandemic, international price spreads for LNG collapsed to a point well below the marginal cost of US exports. These upside-down economics led to mass LNG export cancellation to purchasers in Europe and Asia. Given these supply issues, current gas storage levels in Europe are particularly low for this time of year. In the coming months, demand for US LNG exports will remain high as overseas economies continue to recover and demand for natural gas increases.
Overall, there are very few bearish fundamentals in the US natural gas market. Production rates have slowly recovered in the wake of the lowest spot natural gas prices in the last 25 years. This coupled with global economic recovery, warmer temperatures, and higher demand have contributed to the rally in natural gas and the significant increase in near-term prices. The long and slow decline of gas prices over the last decade may be a thing of the past as this market seems to be heading in a very different direction with few indicators that there is anything that will stop the bulls any time soon.