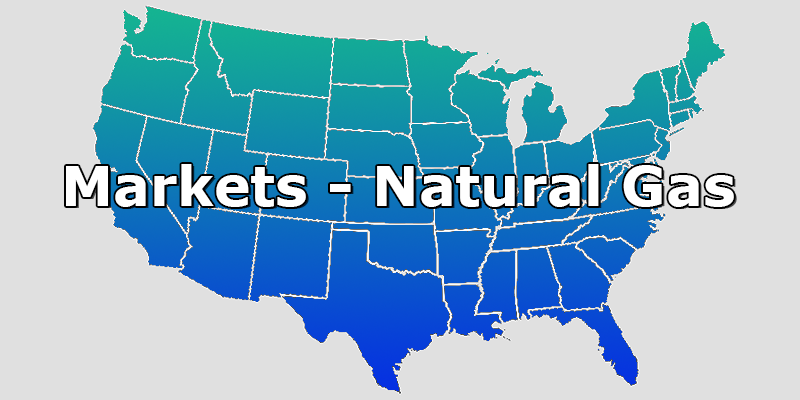
How much farther will natural gas prices fall? Of course, no one really knows the absolute answer to that question. But in the near-term, the answer may be $2.40/Dth. Figure 1 shows the NYMEX trading history for a one-year period from August 2019 to July 2020. One can see that futures prices declined steadily until last fall and then began to rise until March of this year. Since then, NYMEX futures have persistently fallen from its peak of $2.91/Dth on March 21st. The question among traders was: how low can it go? As shown in Figure 1, the price floor for the August 2019 to July 2020 strip seems to be in the neighborhood of $2.40/Dth, which is where the market stopped falling back in the last week of June and the first week of July. One of the reasons for the recent bearish price trend has been the large amounts of natural gas that have been put into storage.
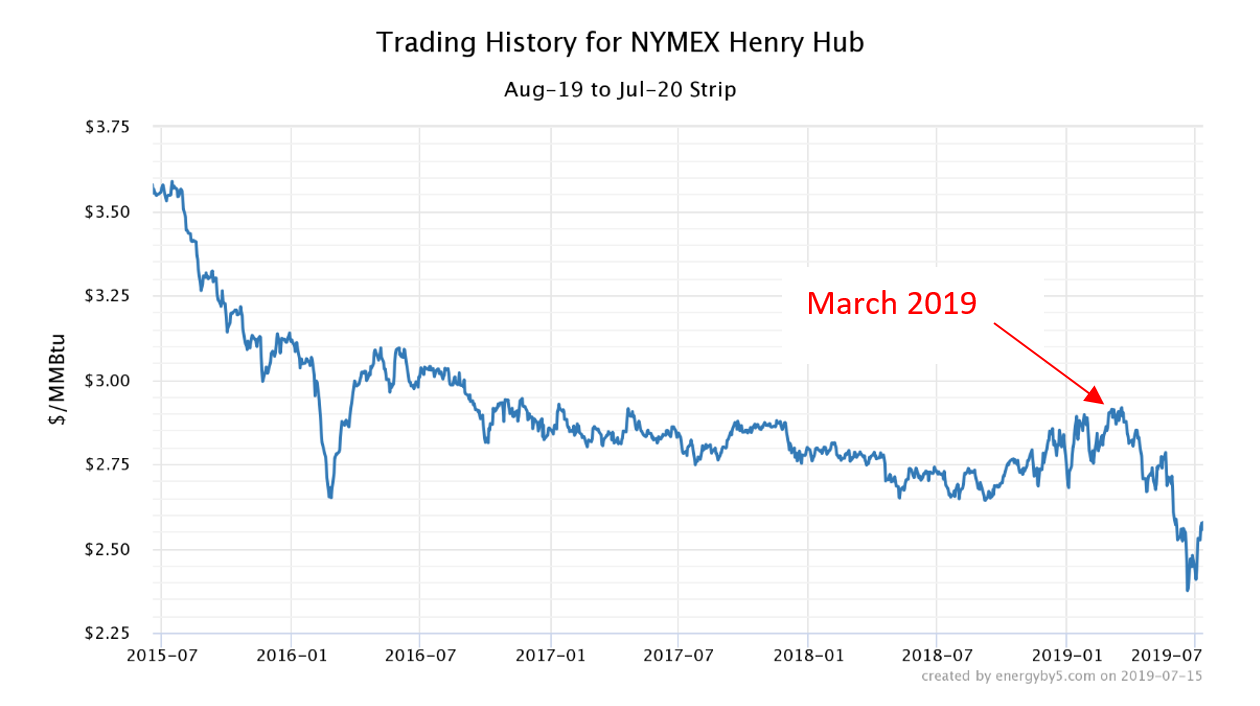
Figure 1: Trading History for NYMEX Henry Hub for Aug 2019 to July 2020 Strip, by energyby5.com
Coming out of this winter, massive amounts of natural gas have been produced and put into storage. Figure 2 shows the amount of natural gas in underground storage. The blue line shows current gas storage levels compared to the 5-year average (gray line) and the 5-year maximum and minimum storage values (gray-shaded area). While gas continued to be placed into storage through September, the injection season ended with gas storage levels that were far below the 5-year minimum. As more gas was burned during the winter heating season, more was withdrawn from storage. These withdrawals increased and storage levels decreased through March. This was the main factor behind the increase in gas prices from September 2018 through March 2019 in Figure 1. Since March, large amounts of natural gas have been placed into storage. The steep slope of the blue line in Figure 2 shows that the gap between current storage levels and the 5-year average has closed over the last three months. Natural gas storage levels now have the smallest deficit to the 5-year average since December 2017. Both mild temperatures and strong amounts of gas production have helped to improve these storage levels. And this is what was behind the significant drop in natural gas prices over the last several months. The slight rally in gas prices that we have observed over the last couple of weeks is likely due to the fact that gas producers are not profitable if prices fall too far, which was prompting the question of how far gas prices could fall.
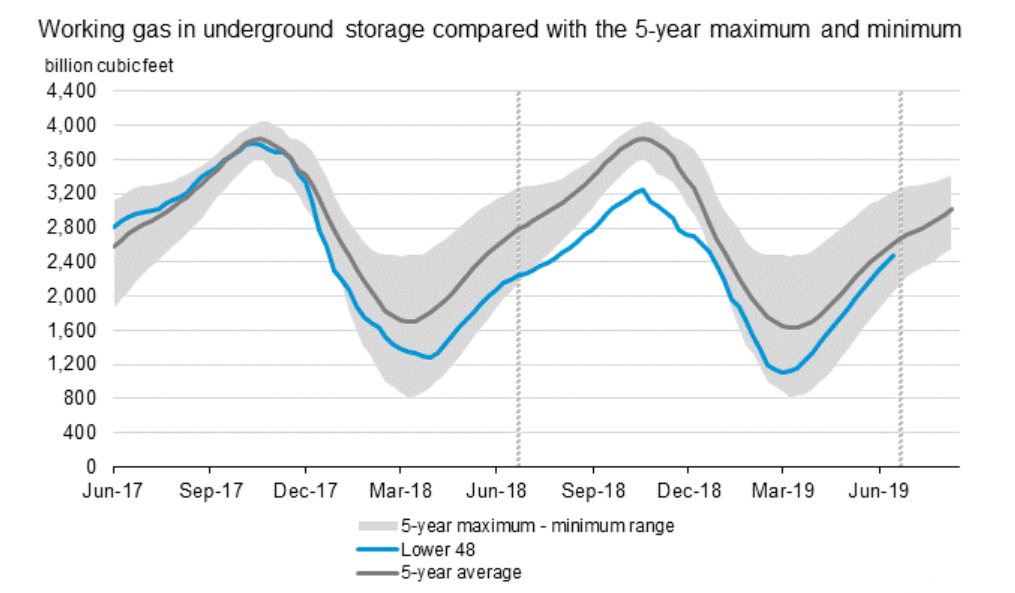
Figure 2: Natural Gas Storage Levels, by energyby5.com
Long-term natural gas prices also remain attractive. Figure 3 shows the 48-month forward NYMEX Henry Hub trading range for natural gas. The height of the green bar shows the 4-year range of low and high prices for gas delivered in calendar years 2020-2024. The black bar shows where prices were trading as of 7.15.19. This chart shows that while there is a slight degree of contango (where prices increase with time) for prices from 2020 to 2024, there is only a 17 cent/Dth increase over this five-year period. On the whole, gas futures prices are near the bottom of their 4-year trading range. This is a strong purchasing signal.
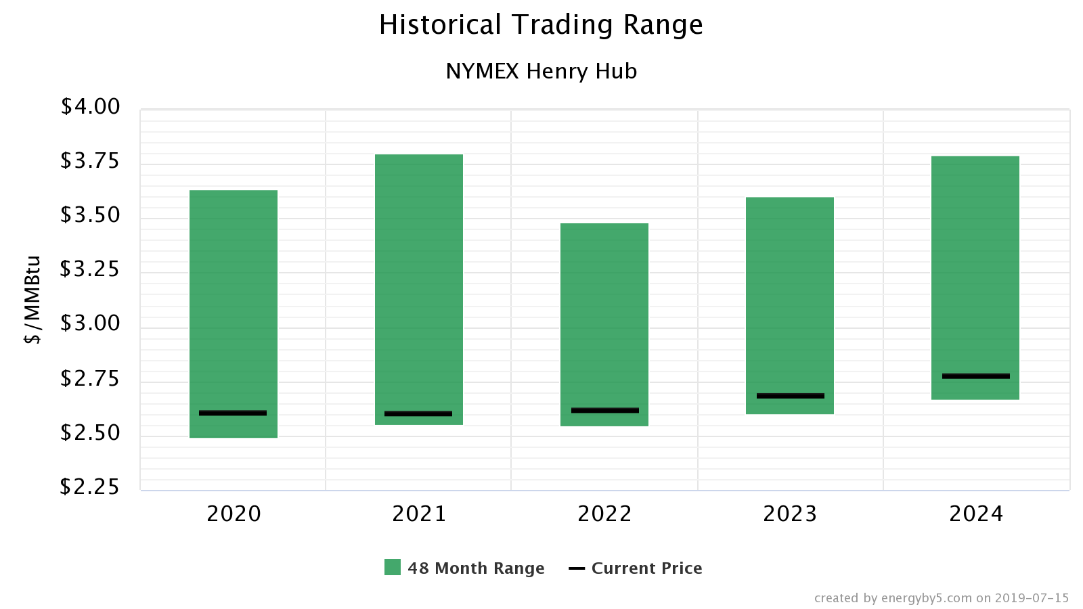
Figure 3: NYMEX Trading Range History, by energyby5.com
There is one trader-ism that certainly applies in this current market condition, and that is - never grab a falling knife. In relation to commodities markets, this means that one should wait for a market to decline to a level that is near its support levels or price floor before making any purchases. This is exactly what we have observed over the last several months. Near-term prices have declined to a point where they have begun to rally. Additionally, futures prices out to 2024 are also in a favorable place to make a gas purchase. Clients should seriously consider making gas purchases now given that near-term prices seem to have hit their support levels and that futures prices are near the bottom of their four-year historical trading ranges.