
Market Info & Updates


Topics: Natural Gas
Industries: All industries

Liquified Natural Gas (LNG) is produced through a process that super-cools pure methane gas to approximately -260ºF, which enables it to be stored in liquid form at normal atmospheric pressures and conveniently shipped overseas. Now that’s super cool in our book.
Today, LNG is quickly becoming the world’s replacement for crude oil. The largest LNG cargo ships can carry the equivalent of roughly 5.5 billion cubic feet (Bcf) of vaporized natural gas (5.5 million MMBtu), or about twice the amount of total energy carried by an average, long-range oil tanker. As many countries are looking for ways to reduce their carbon emissions, LNG is quickly becoming the fuel of choice compared to coal and other energy sources.
The biggest issues with LNG are the wild swings in demand for natural gas in countries that lack the capability to easily increase their own domestic production and the slow process to increase production capacity. A new LNG liquefaction facility can take three to five years to go from the Final Investment Decision (FID) phase to the commencement of production.
US export levels have been relatively consistent over the past 12 months. All major US facilities have been running at full capacity since late 2020 to help recover from low natural gas inventories that developed in Asia and Europe last winter. Both spot and LNG futures have soared to record highs with many nations increasing their purchase of LNG throughout the summer to shore up low storage levels. Winter delivery to the Japan/Korean LNG trading hub traded as high as $43/MMBtu on October 6, 2021.
This large arbitrage opportunity, the greater than $35 per MMBtu difference between prices at Henry Hub in Louisiana and gas prices in Asia, has generated significant conversations with international energy companies looking to execute contracts to help finance the completion of additional export facilities across the US Gulf Coast. This month it was reported that the Chinese energy company Sinopec signed a deal with Venture Global LNG to provide 4 million metric tons per year for the next 20 years from their soon-to-be-completed Calcasieu Pass LNG export terminal Plaquemines.
Reuters also reported that Venture Global has multiple projects in development in Louisiana, with around 60 million tons per annum (MTPA), with an average cost of about $5 billion dollars for every 10 MTPA of liquefaction capacity. Even if these Venture Global projects are the only ones to come online, they would almost double the current US liquefaction capacity of about 10.5 Bcf per day.
Figure 1 shows the average daily production totals for the US export terminals, along with their total capacity (gray shaded area).
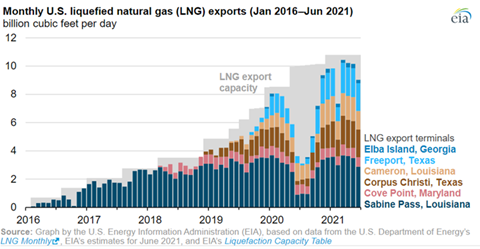
Figure 1: Monthly US Liquefied Natural Gas Exports Jan 2016 - Jun 2021 from eia.gov
To put this amount of natural gas into perspective, if averaged over an entire year, all residential customers in the US use about 12.8 Bcf per day. The entire commercial sector in the US only consumes the equivalent of 9.5 Bcf per day, which is approximately the same amount as the additional three Venture Global projects that are in development.
With significant price differences for natural gas in global markets compared to domestic prices and the capability and willingness of many companies to invest capital to create export facilities, there is a significant shift underway in domestic natural gas market fundamentals. The complexities of a global gas market, foreign exchange risk, geopolitical risk, and global weather patterns will start to become much more relevant for natural gas market analysts as the US exports significantly more natural gas to supply the world’s demand for this abundant energy source.

 Oct. 9, 2026
Winter 2026-27 Outlook for Gas and Power Markets: 5 Things to Know from our Live With 5
 Sept. 10, 2026
Buy or Wait? Why Waiting is Also an Energy Buying Strategy
 April 27, 2026
What the Middle East Conflict Means for Energy Markets
 Feb. 24, 2026
Stress Test: How Winter Storm Fern Moved Energy Markets
 Feb. 24, 2026
Watts Next? 2025 Lessons and 2026 Predictions
 Dec. 9, 2025
The Coming Surge: What Large Energy Users Need to Know About 2026 Electricity Prices
 Aug. 20, 2025
August 2025 - Energy Market Letter
 April 25, 2025
Locking in Energy Rates Now Could Benefit Your Business
 Jan. 14, 2025
WINTER POWER OUTLOOK: RELIABILITY & RISK ASSESSMENTS ACROSS KEY MARKETS
 Aug. 29, 2024
SUMMER 2024 MARKET REVIEW
 June 26, 2024
How Hurricanes Affect Energy Prices
 May 14, 2024
May 2024 - Energy Market Letter