
I am pleased to forward 5’s fourth quarter overview of the energy market. This issue focuses on two topics that were particularly significant in 2015. The first is the continued decline of the price of natural gas and electricity. While the price decline creates an opportunity for energy buyers, it is also accelerating the shift in generation from coal to natural gas. If continued, this shift should put upward pressure on natural gas and electricity prices. The second topic is the increasingly complex international, federal and state regulations that impact renewable energy development, and in particular, how these shifting regulations could impact on-site generation projects. The shifting regulatory landscape underscores the importance of fully understanding the utility tariff structure and potential regulatory risk before investing in an on-site renewable project.
Natural Gas Prices
I have been working in these markets since the late 1990s. At many times over the past years, I have told clients that I could not foresee natural gas prices trading below $2/MMBtu level. I was wrong: this is exactly what happened in Q4. Prices have rallied since that time, but levels are so low (from a historical perspective) that I thought it was worth sharing a chart we often use with our clients to show how current prices compare to those over the past 20 years.
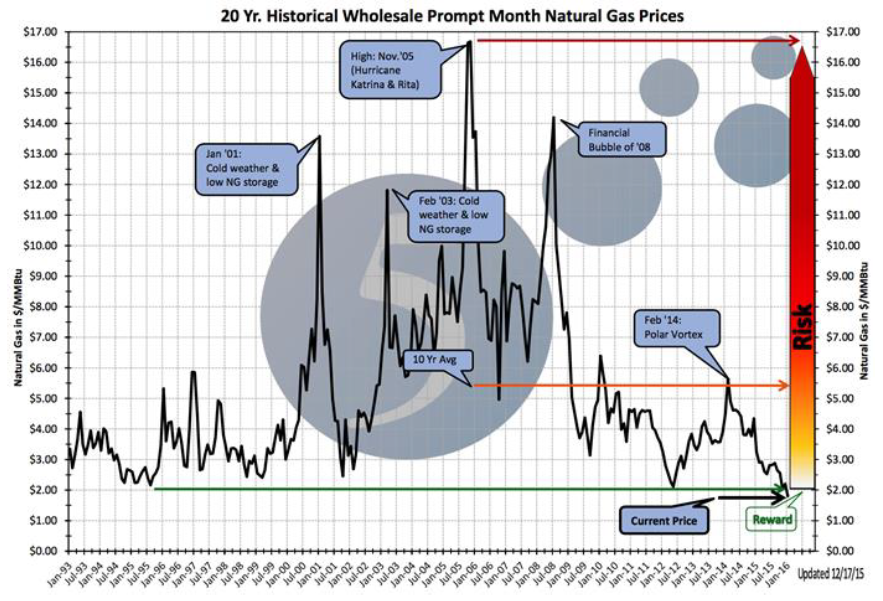
Source: energyby5.com
Looking at current prices in a historical context makes it abundantly clear that this is a unique opportunity to hedge exposure to forward natural gas and electricity prices. While we do not know when or why natural gas prices will rally, we are sure of one thing: the risk/reward line on the chart is a strong indicator for taking steps today to reduce exposure to a future rally in natural gas and electricity prices.
Low natural gas prices are accelerating the shift away from coal as the primary source of energy in the United States. In October 2015, natural gas consumption increased 12.3% from October 2014, while coal consumption decreased by 11.7% from October 2014. October also marked the fourth month in a row that natural gas surpassed coal as the primary fuel for electricity generation:
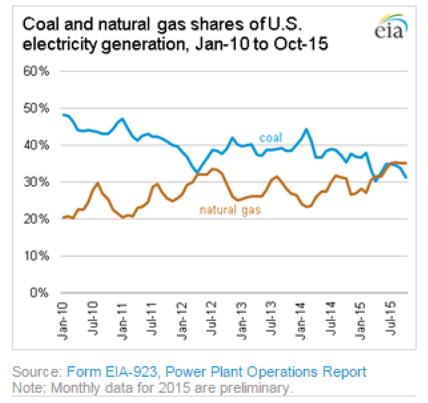
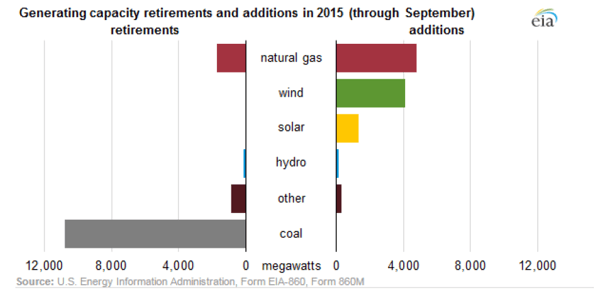
This is not a new trend. When natural gas prices rise, coal generation increases (this was the case between April 2013 and February 2014). When natural gas prices drop, as it has from February 2014 until today, natural gas generation increases. Generation retirements and planned capacity additions tell the same story. The chart below shows generation retirements and additions in 2015. Coal plant retirements account for almost all of the reduction in generation capacity. At the same time, almost all new capacity has come from new natural gas and renewable resources.
I expect this pattern to continue in 2016. The following map shows the size, type and location of new generation facilities scheduled to come on line between November 2015 and October 2016.
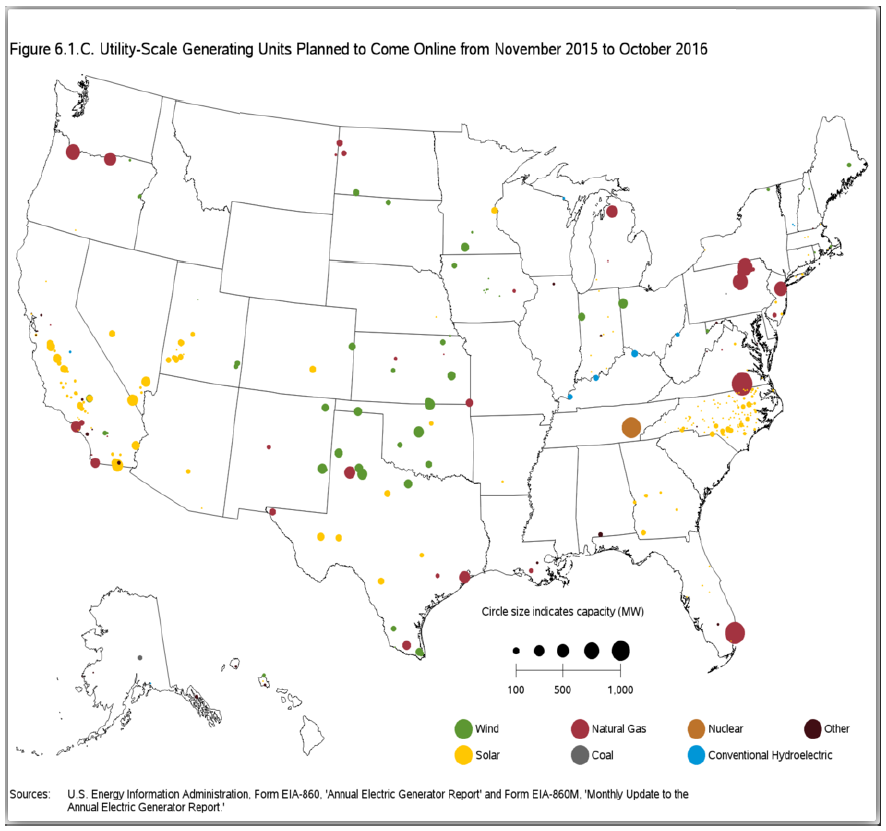
With the exception of a single nuclear facility and four small hydro plants, all of the dots are red (natural gas), green (wind) and yellow (solar). While the abundance of natural gas from fracking and reduced energy usage has depressed the price of natural gas, at some point the increased natural gas usage for electricity generation should reverse this trend. As noted earlier, the future market for electricity and natural gas remains liquid and we are actively hedging clients for periods through 2023. Please do not hesitate to contact us if you are interested in reducing your exposure to future price increases.
Q4 – Climate Change Regulation
There is no scientific connection between short term weather patterns and long term climate change. Yet December set high temperature records across the country and also saw significant developments in climate change regulation.
The Paris Accords
In December, negotiators from 195 nations reached an unprecedented agreement to address climate change. The United States Congress remains split on climate change, however, the Paris agreement reflects increasingly strong global support for policies designed to limit climate change. Unlike prior efforts that sought a top down series of emissions reductions, the new accord relies on each country to establish its own emissions reduction goals and processes for meeting such goals. The extensive commitments made by China as a part of these accords demonstrated a new level of international commitment to combating the issue of climate change. China’s new commitments on climate change appear to reflect increased concern about domestic pollution levels and rising sea levels along China’s coast.
Opponents to climate change regulations will point to the fact that the Paris agreements did not result in any new, legally binding obligations. While this is true, the accords set up a much stronger framework for additional emissions reductions than prior international agreements. Key agreements made in Paris include:
- A global commitment to hold global increase in temperature to below 2 degrees Celsius above pre-industrial levels and to pursue efforts to limit the increase to only 1.5 degrees Celsius.
- Pledges from 195 nations to make “Intended Nationally Determined Commitments”.
As part of the Paris agreements, the United States pledged to cut carbon emissions by 26-28% from 2005 levels by 2025. A portion of this target would be met through the EPA’s Clean Power Plan, which requires significant reductions in emissions from US power plants. As noted in earlier letters, this legislation is currently being challenged in court. Even if the CPP survives legal hurdles, additional steps will be needed to meet US climate change commitments made in Paris. How domestic and global political forces and markets react to the Paris agreements in the coming months will clarify the importance of these commitments and their potential impact on the energy market.
Federal Tax Incentives for Renewable Energy
Shortly after the Paris Accords were reached, Congress passed a surprising extension of the federal tax incentives for renewable energy development. As noted in several prior letters, the 30% Investment Tax Credit (ITC) for solar energy facilities was scheduled to drop down to 10% for all facilities placed in service after December 31, 2016 (and certain significant incentives for wind projects had expired at the end of 2014). It takes over a year to develop an industrial scale solar facility, so the phase out of the solar ITC was significantly impacting large scale solar development (and solar developers were refocusing on smaller projects). The new legislation, signed into law in December, extended wind incentives and the ITC for solar through 2019. Bonus depreciation, an additional tax incentive, was also extended through 2019. As part of the congressional compromise that included these renewable project incentives, Congress agreed to drop the 40 year old oil export ban. On New Year’s Eve, ConocoPhillips exported crude oil from Corpus Christi – the buyer was a Dutch oil trading firm.
Nevada/Hawaii – The Net Metering Debate
Not all regulatory action in Q4 supported renewable development. In many states, net metering is an important part of the regulatory structure that supports on-site solar projects. Net metering allows an on-site solar project to export to the grid excess solar power (electricity generated that exceeds on-site demand) and receive a credit for such power that can be used at other times in the year when the consumer is a net purchaser of electricity. In many markets, the credit an owner of a solar project gets for electricity exported to the grid is the same price that the consumer would pay at its meter when it is a buyer - the retail price for electricity.
Opponents of net metering (which often includes utilities that own the regulated electric transmission and distribution infrastructure) argue that under net metering, owners of solar projects do not pay their fair share of the cost of operating and maintaining the electricity grid. These opponents argue that the utility should either not have to pay at all for this excess energy (the rule in Texas) or only pay the wholesale price for this electricity. The difference between the retail rate and the wholesale rate is primarily the charges paid for transportation and distribution. These T&D charges vary but are typically around 40% of the total retail tariff. As a result, limiting net metering payments to the wholesale portion of the rate will reduce the amount paid to the owner of the solar system for exported electricity by 40%.
In December, the Nevada PUC decreased the net metering rate paid to rooftop solar customers from the retail rate to the wholesale rate. Equally important, the Nevada PUC ruled that the new rate would be applied retroactively to all exporters of solar power. In response to this regulatory decision, one of Nevada’s largest solar providers, Solar City, announced that it would cease sales in Nevada. We expect that the Nevada PUC’s decision will be challenged in court. The change to net metering rules was strongly supported by NV Energy, Nevada’s largest utility.
In October, the Hawaiian PUC voted to immediately close net metering to new applicants. The PUC stated that this was necessary to insure that all parties shared in the benefit of distributed generation (not just those who could afford solar panels). In place of net metering, the PUC offered two options, (i) a much lower rate for electricity exported by on-site solar systems, and (ii) a self-supply option, one that effectively blocks the on-site project from exporting solar energy. Owners of solar projects that select the self-supply option must use storage or size the project in such a way that it never produces power in excess of demand. The PUC also adopted additional changes, such as larger minimum rates. Given the success of utilities that oppose net metering in Hawaii and Nevada and the rapid expansion of residential and commercial solar installations, we expect more challenges to net metering in other states in 2016.
Solar Economics in Texas
Potential purchasers of on-site solar projects should look closely at their retail tariffs and pay particular attention to how these tariffs may impact a project’s economics. Texas offers a good example of a market that requires careful analysis. Texas generally does not allow net metering, but the combination of good sun and low priced solar panels has created significant opportunity for utility scale solar projects. In a recent procurement, Austin Energy announced it had received 1,295 MW of solar bids at prices below $0.04/kWh. Low prices for wholesale projects suggested that on-site solar was a viable option for Texas based commercial and industrial energy users.
The key challenge to a solar project’s economics is the structure of utility delivery charges. In many states, delivery charges are set up as a per kWh charge. These can be directly offset by on-site solar generation. But in Texas, commercial and industrial tariffs use demand charges set on a per KW basis to calculate delivery charges. Since solar generation does not operate at all hours of the year (due to available sunlight), the installation of solar panels may not materially reduce a customer’s per KW peak demand (the maximum amount of grid power used at any point during the year). For this reason, delivery charges may not be materially reduced by an on-site solar project. In effect, a Texas commercial customer could pay the same transmission and distribution rates with or without a solar project. In the near term, while utility scale projects remain viable in Texas (and should be further supported by the extension of the ITC), for C&I customers, the lack of a viable net metering tariff and the demand-based structure used in transmission and delivery tariffs for most C&I customers call for careful due diligence of any on-site solar projects.
Changes to regulation and technological innovation will continue to impact the economics of many on-site projects. At 5, we are spending more and more time working with our clients to make sure they fully understand the economics of on-site projects. While changes to regulatory structures may challenge renewable project economics in some markets, in other markets these renewable projects are cost effective ways to purchase electricity. We should also note that many of the challenges faced by on-site solar projects (such as the lack of net metering) can be addressed by energy storage (batteries). Given the level of interest in renewable resources and other distributed energy solutions, we anticipate continued development of new ways to use on-site generation and storage to manage energy costs.
Finally, 2015 was a great year for 5. We are now working with over 1,300 clients, we continued to expand our operations throughout the United States, and we added our first client in the recently deregulated Mexico market. I would like to take this opportunity to thank everyone on our team at 5 and all of our clients for their continued support.