There’s been a lot of news around the natural gas market this past month. Most of that news has been bad for producers and good for buyers of the commodity. Natural gas injection quantities have, as expected, been significantly stronger this summer compared to last year. The amount of gas consumed for power generation has, in general, been in line with expectations and similar to last summer.
Total natural gas in storage after Thursday’s report now stands at 2,738 billion cubic feet (Bcf). This is 351 Bcf, or 14.7%, more than last year at this same time. This build is extraordinary considering that it was only 4 months ago (March 8th) when there was 342 Bcf less gas in storage (a 22.3% deficit) compared to the prior year. The magnitude of the amount of gas placed into storage over the last few months can be seen in Figure 1. The red line shows the actual amount of stored natural gas compared to the five-year average (blue line) and the five-year historical range (gray area). The dotted red line shows the amount of gas expected to be placed into storage over the next several months. The steep slope of the red line from March through August shows the rapid rate at which gas has been placed into storage.
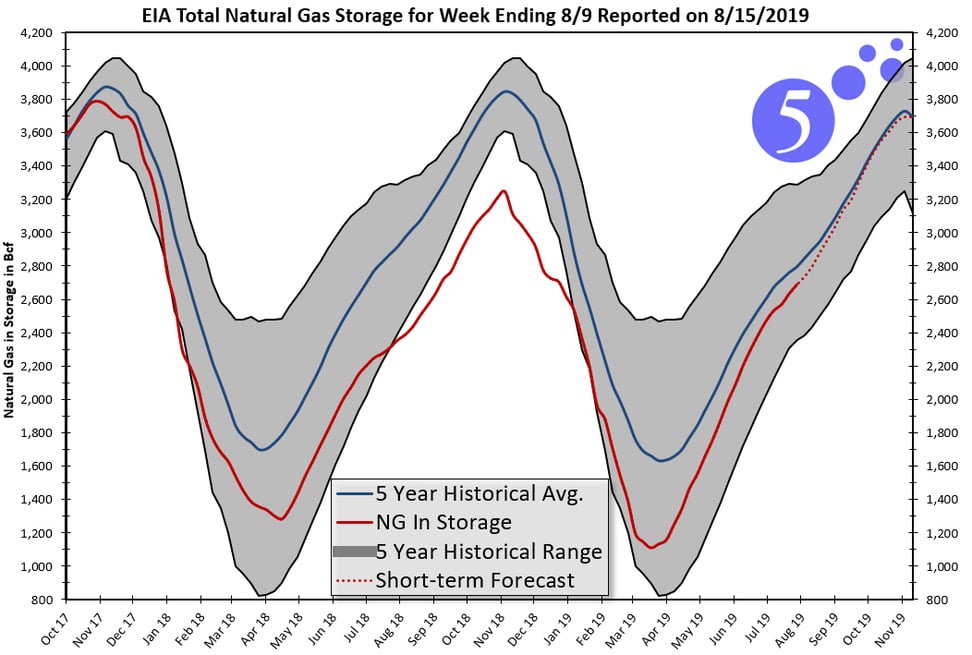 Figure 1: Trading History for NYMEX Henry Hub for Aug 2019 to July 2020 Strip, by 5
This dramatic shift from deficit to surplus over the last few months has had a significant impact on short term natural gas prices. Figure 2 shows calendar year gas prices for 2020 to 2024. The height of the green bar shows the range of high and low prices over the last 12 months – the black bar is where prices were trading on August 15, 2019. Note that prices for 2021 through 2024 are all currently trading on their 12-month lows, while 2020 is within 2¢ of its 12-month low.
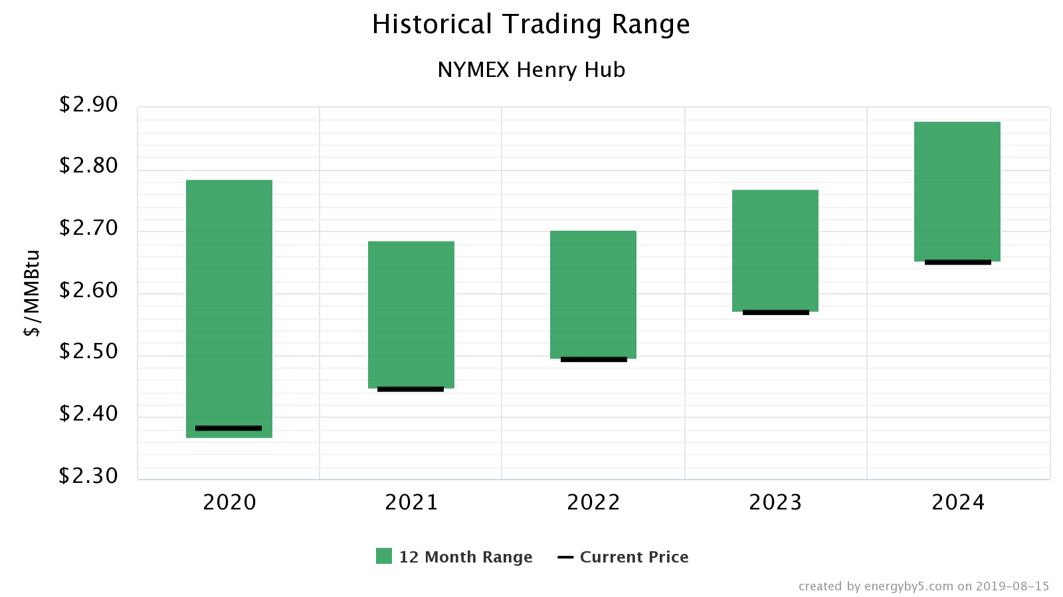 Figure 2: Historical Trading Range NYMEX Henry Hub, by 5
Within the last few trading sessions, the prompt month (September’s contract) has started to rally off the 3-year lows. This is most likely due to the large amounts of natural gas that are being burned to support late summer cooling demand. The green arrow in Figure 3 shows this recent rally in the September gas contract.
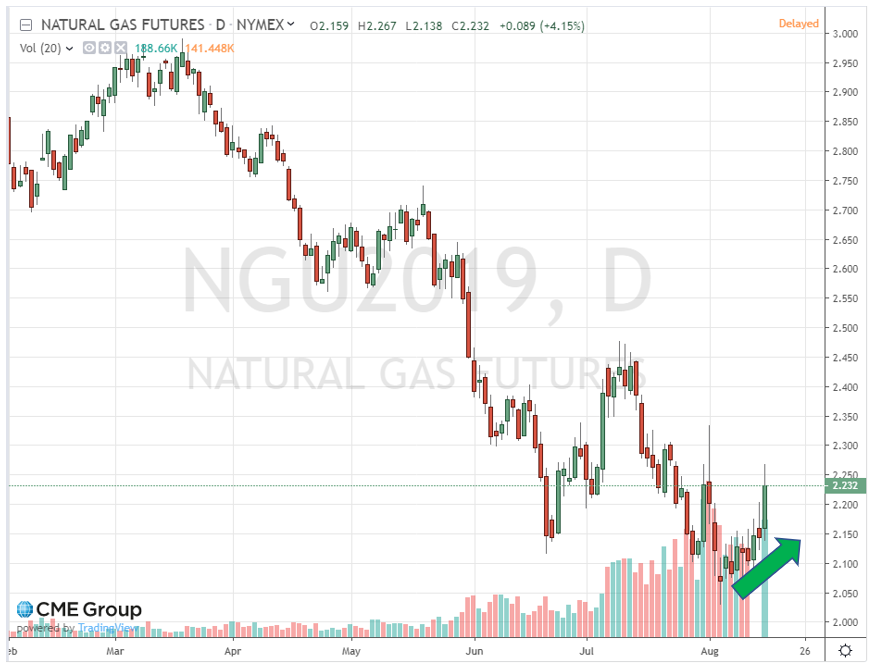 Figure 3: NYMEX Natural Gas Futures, by CME Group
In other natural gas news:
During the overnight hours of August 1st, TETCO, one of the oldest natural gas pipelines in America, experienced it’s third rupture in the Appalachian region. One occurred in Ohio last winter, another rupture happened near Pittsburgh in May of 2016, and the third pipeline break happened near Danville, Kentucky this month. The damage and resulting explosion on the pipeline in Kentucky took place on a 30-inch pipeline section of the TETCO system (built in 1942) which now transports natural gas out of the Marcellus and Utica Shale regions and moves it south to market (See Figure 4).
One person died, 6 were injured and many homes were destroyed from this recent pipeline explosion. Out of caution, two parallel TETCO pipelines were taken out of service in addition to the one that was damaged. This pipeline closure prevented about 1.7 Bcf per day of natural gas from flowing out of the Marcellus and Utica regions south to the Gulf Coast. Prices immediately increased at the Henry Hub in Louisiana and decreased by approximately 10¢ per MMBtu at TETCO’s M2 zone for both the September and October contracts.
Ageing pipelines in Appalachia coupled with the large amounts of gas that are flowing through those pipelines increases the risk of additional pipeline failures. Approximately one-third of the natural gas produced in the United States comes from the Utica and Marcellus Shale regions. The ageing gas transportation infrastructure and the potential for future pipeline ruptures has the potential to dramatically increase the volatility of gas prices, both regionally and nationwide.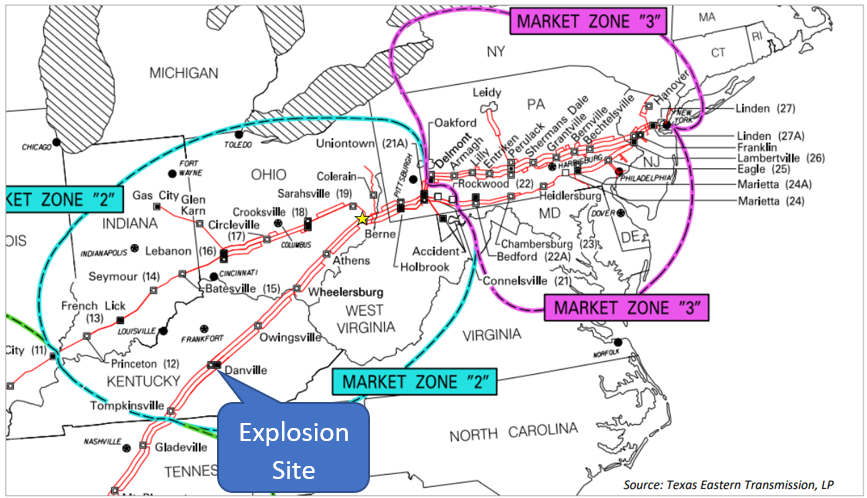
Figure 4: Explosion Site of the TETCO natural gas pipelines in Appalachian region, by Texas Eastern Transmission, LP

