
There are two things we were watching closely this summer:
- The temperature and its impact on the ERCOT reserve margin.
- Tariff updates from the delivery companies.
In terms of the weather and ERCOT reserve margins – everything was fine until the second week of August. In the month of July, North Texas didn’t see a 100º day until the last day of the month, which is rare. But as mother nature often does with averages, August arrived and reset everything back to “normal.”
The high-pressure systems that have a tendency to park over Texas during the summer months finally showed up in the middle of August, which brought higher than average temperatures and no precipitation. And while those two factors alone do not cause power grid emergencies, it was a lack of sustained winds and low output from wind-generating assets in West Texas that pushed the grid to the tipping point.
On Tuesday, August 13th and Thursday, August 15th , Texas moved very close to running out of excess generating capacity. On both afternoons, ERCOT was forced to deploy its Demand Response reserves (load that has contractually agreed to reduce demand when called upon) because there was not enough electricity supply to meet the demand. When this situation occurs in ERCOT, it almost always coincides with Real Time prices rising to its peak of $9,000 per MWh ($9.00 per kWh).
During the week of August 12th, Real-Time prices were above $8,500 for 4 solid hours, above $4,000 for 3 hours and above $1,000 for 4 hours, bringing that week’s Daily Average to about $570 per MWh (57¢ per kWh), with Tuesday and Thursday averaging above $1,000 per MWh. Real-Time prices during that week are shown in Figure 1.
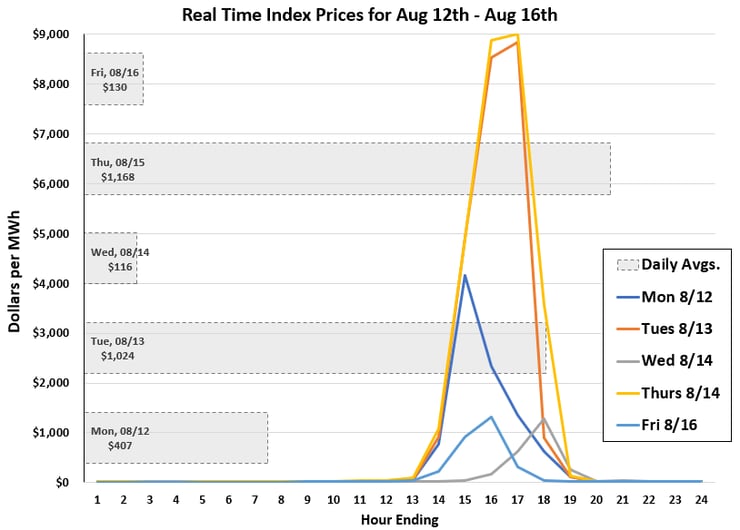
Figure 1: Real-Time Index Pries for August 12th - August 16th, by 5
This had major financial impact on any retail customer on an index-based agreement in Texas without the ability to curtail load, and materially affected summer On-Peak prices for the next few summers. This will also potentially impact any clients who are not already hedged for the next few summers. Figure 2 shows the forward prices for On-Peak (weekdays from 6 am to 10 pm) power in North Texas, both on July 31 (blue line) and September 17 (black line). One can see that prices for summer 2020 and 2021 have increased by approximately 50% and 30%, respectively, in the wake of August’s spot price volatility.
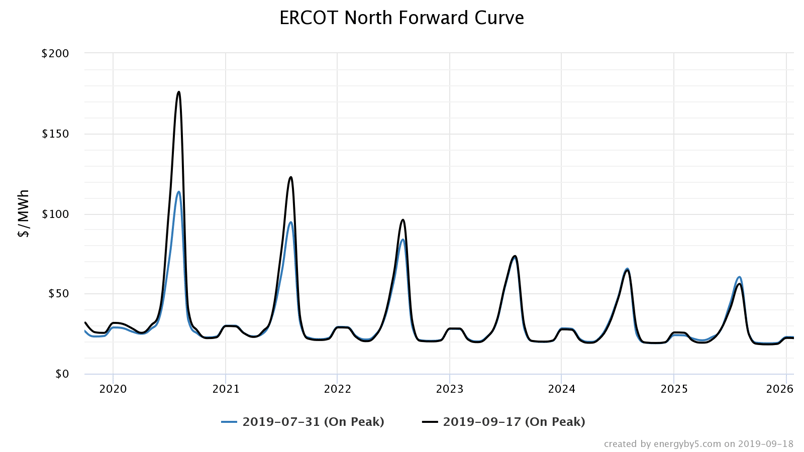 Figure 2: ERCOT North Forward Curve, by 5
The power grid emergencies in August also had a significant impact on the average price for the entire calendar year of 2020. Figure 3 shows the 36-month trading range of wholesale electricity prices from 2020 to 2024. The black line indicates where prices were trading on September 18th. This chart shows that the price for wholesale electricity in 2020 is now near the top of its trading range. While prices also increased for calendar year 2021, there was a minimal impact on the calendar years beyond 2022, which are still trading near the bottom of their trading ranges.
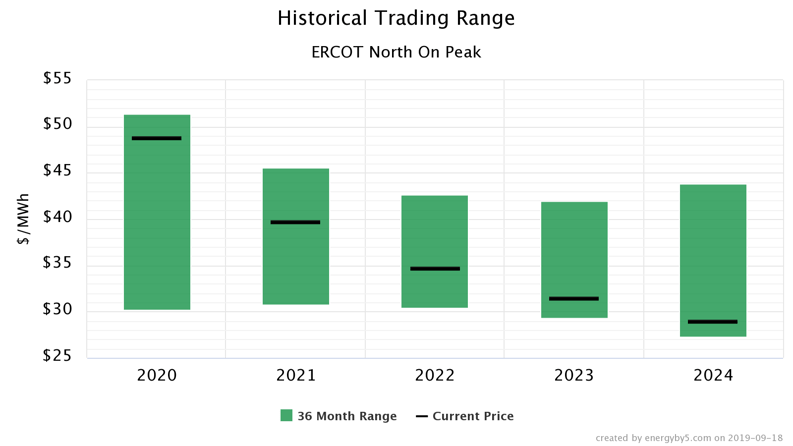 Figure 3: Historical Trading Range - ERCOT North on Peak, by 5
Changes to All Delivery Tariffs:
Twice a year, on March 1st and September 1st, all Investor Owned Utilities (i.e., the utilities) update their tariffs to reflect their changing costs to fund their share of the state’s electricity transmission system. On most invoices, these charges are identified as “Transmission Cost Recovery Factor”, “TCRF” or simply “Transmission.” As expected, all utilities filed with the Public Utility Commission this summer for their September update. Table 4 shows the current, previous and change by utility for each of the major commercial rate classes in Texas.
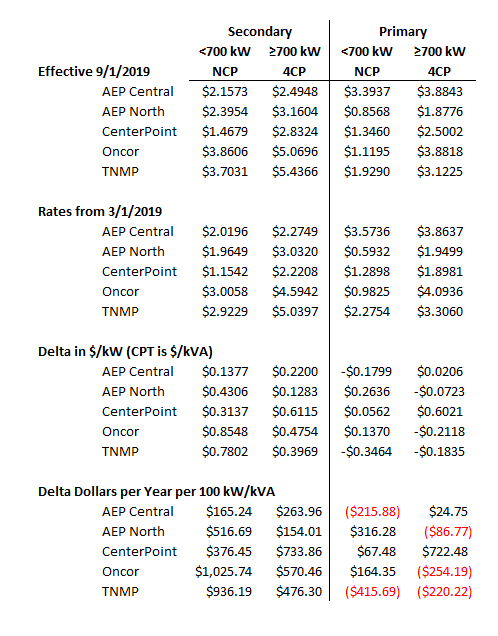 Figure 4: Major Commercial Rate Classes in Texas, by 5
This table shows that Secondary voltage clients (usually those who don’t own their own transformers near their meters) in AEP Central and Oncor can expect to see the largest annual cost increases with the updated tariffs. The real impact to most clients can be seen in the bottom section of the chart, which displays the total annual dollar impact for each 100 kW of peak demand (4CP) as defined by each utility tariff. This table also shows that some Primary voltage clients across all utilities, except CenterPoint, can expect their transmission costs to decrease in the new tariff.


