Anyone from New York knows that New York is really made up of two states: upstate and downstate. Some will even put a finer point on this and claim that New York City is distinct from downstate and the same can be said of New York’s electricity markets. Today, there are two factors that have a significant impact on the price of electricity throughout New York. One of those factors is tied to regulatory developments in Albany and the other is connected to the way capacity has been trading across the state.
Lingering doubts about whether the state’s proposed carbon pricing plan can be implemented has put downward pressure on wholesale electricity prices. In 2018, a plan was developed that would combine the state’s competitive electricity markets with its aggressive carbon reduction goals. This proposal would create a premium on electricity produced from fossil fuel power plants. This plan to align the wholesale power markets with the state’s public policy objectives is known as carbon pricing. Initially, the goal was to implement carbon pricing in 2022. However, doubts have been raised about whether the carbon pricing plan can be implemented. These questions have put downward pressure on electricity prices across the state and especially in New York City.
Figure 1 shows the trading history for electricity in calendar years 2020 to 2025 in New York City. The sharp increase in power prices across the state in May 2018 coincided with the release of its carbon pricing proposal. Electricity futures in New York City immediately rose by approximately 35%. Similar cost increases were observed in other regions of New York State because of the large number of fossil fueled power plants in the state. Since May, wholesale electricity prices have fallen almost as quickly as they rose after the carbon pricing proposal was first announced. Over the last 3 months, wholesale prices have remained flat with average wholesale prices of approximately $40/MWh. This same trend is applicable for upstate New York too. In the Rochester area, wholesale prices started to fall last spring and are now averaging between $23 and $27/MWh across calendar years 2020 to 2025.
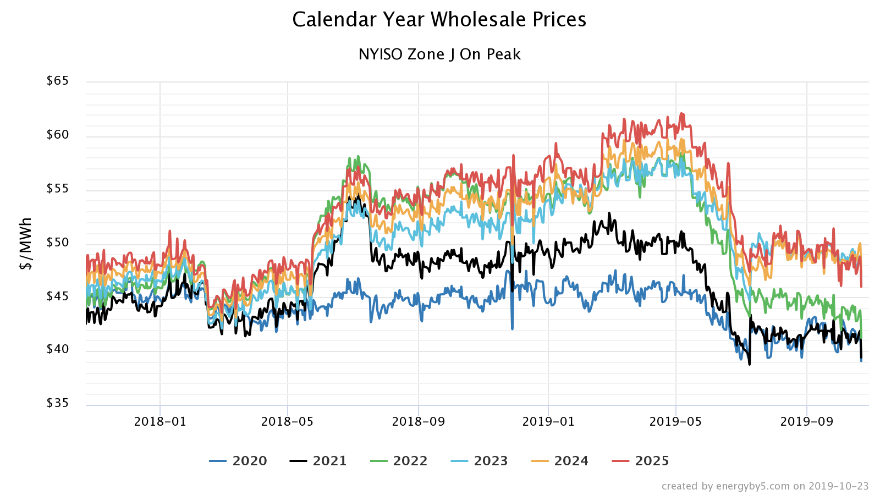 Figure 1: Calendar Year Wholesale Prices, by 5
Unfortunately, falling wholesale prices have not necessarily translated into lower retail electricity prices – especially in New York City. One reason for this is a rally in the downstate capacity markets.
Capacity is a commitment by an electricity generator to provide electricity when it is needed for a specific period of time to ensure there is enough supply to meet the demand. In many ways, capacity is like an insurance payment that is paid in advance to ensure that electricity supply and demand are in balance. Capacity can range from 15% to 45% of a retail electricity price, depending on the location. Lately, capacity prices in Upstate New York have been falling, while capacity prices in New York City have been rallying.
Figure 2 shows how capacity prices upstate (orange line) compared with capacity prices in New York City (blue line). This clearly shows that for the last five years, capacity prices have fallen throughout the state. However, this summer’s capacity auction prices cleared at their highest level in New York City in four years, and this winter’s prices are also slightly higher than last winter’s auction results. Today in New York City, capacity is approximately 45% of a retail electricity price. There are other non-energy cost components that have also contributed to higher retail costs in addition to capacity. These components include Zero Emissions Credits (ZECs), Offshore Renewable Energy Credits (ORECs) and Renewable Portfolio Standards (RPS). Collectively, these three components can account for an additional 0.5¢/kWh.
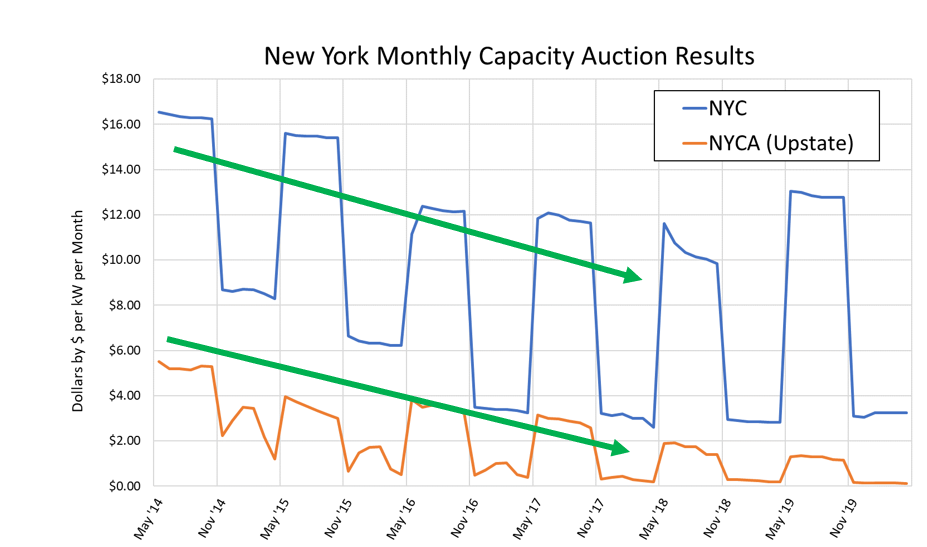 Figure 2: New York Monthly Capacity Auction Results, by 5
In upstate New York, falling forward prices and capacity prices have created good purchasing opportunities. However, in New York City, opportunities created by falling forward prices have been offset by the recent rally in the capacity market and other non-energy cost components.


