
This past August, electricity prices in Texas hit historic highs over several days. Prices rose from the typical range of $20 to $30 per MWh to $9,000 per MWh during the second week of that month. Figure 1 shows daily prices during the week of August 12, 2019.
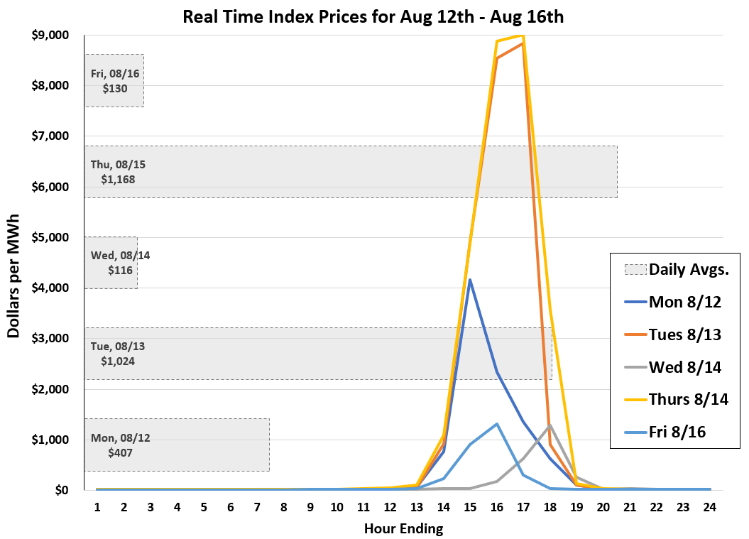 Figure 1: Real-Time Index Prices for Aug 12th - Aug 16th, by 5
High market prices increased both power generators’ revenue and the electricity price paid by consumers floating at index. Surprisingly, the spike in prices was not correlated to extreme temperature. Figure 2. shows the temperature during the peak price days in Texas. It was hot during that second week in August, but well within the range of average historical summer temperatures.
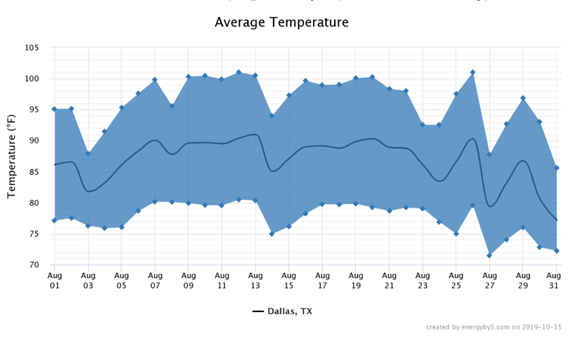 Figure 2: Average Temperature in Dallas, TX, by 5
Low output from wind generating assets throughout the state of Texas was likely the driver of these price spikes. Figure 3 shows wind power generated from assets across the state during the second week of August. The dramatic decrease in output occurred in the late afternoon when demand on the electricity grid was at its peak. This is why the amount of electricity available on the grid did not keep up with demand.
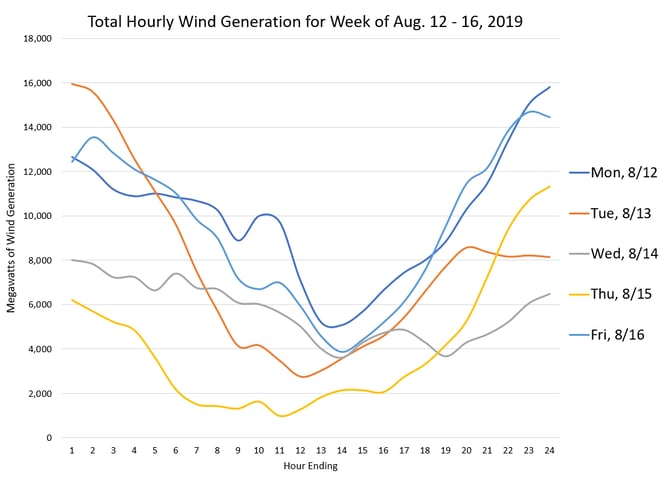 Figure 3: Total Hourly Wind Generation for Week of Aug. 12-16, 2019, by 5
Figure 4 clearly shows the impact of last summer’s price spikes on electricity futures in Texas. Prices for calendar year 2020 (dark blue line) have increase by 25% since August. Similarly, prices in calendar years 2021 through 2023 have also increased significantly. Over the last couple of weeks, futures prices have softened, but it may be a while before the market fully recovers from the events of this past August.
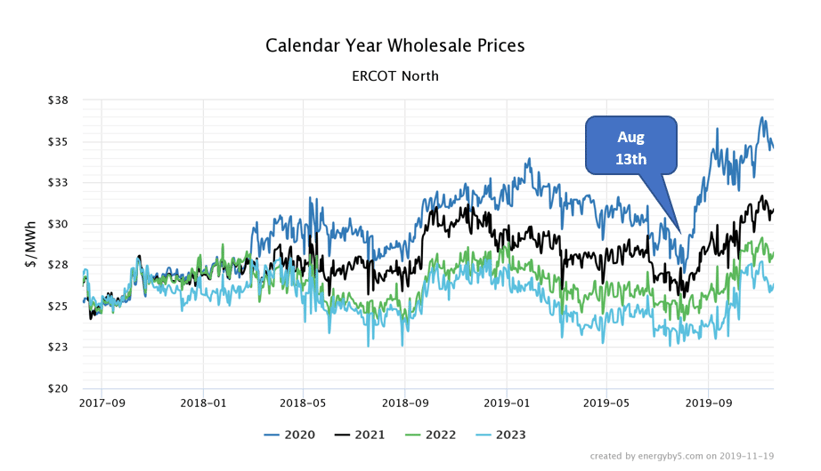 Figure 4: Calendar Year Wholesale Prices - ERCOT North, by 5


