In 2012, The Weather Channel began the tradition of naming winter storms, sorting them alphabetically each winter. One of the most famous was Winter Storm Uri in February 2021. This year’s Winter Storm Fern began as a strong upper-level low around Thursday, January 22, bringing bitterly cold temperatures to the Upper Midwest before moving southeast over the next week. The storm officially lasted from Friday, January 23, through Tuesday, January 27, but the human and financial impacts extended well beyond that single week.
Deaths directly or indirectly tied to the storm were estimated at around 175 people, with daily power outages exceeding 1 million customers on multiple days. As shown in Figure 1, by Monday morning, CNN reported that about half of the contiguous U.S. was covered in snow.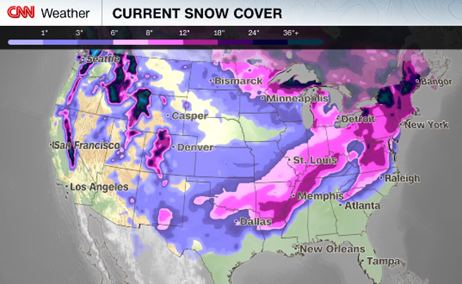
Figure 1: U.S. Snow Cover on Monday, January 26, 2026, CNN
The impact on wholesale spot natural gas and power prices, while not quite as high as Winter Storm Uri in some parts of the country, such as the Plains and Texas, was more severe in the Midwest and Northeast, where Fern hit hardest and was reinforced by subsequent cold fronts and bitter temperatures for more than two weeks.
Natural Gas
Winter Storm Fern set 79 all-time high average daily price records across the country, surpassing Winter Storm Uri’s total of 77. Many of Uri’s 77 records were broken during Fern, particularly in the Northeast (light blue) and Southeast (gold), as shown in Figure 2, where Fern was more intense than Uri.
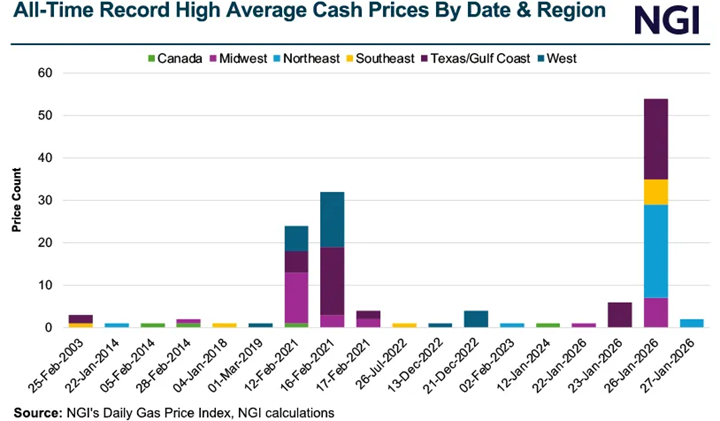
Figure 2: All-Time Record High Average Cash Gas Prices by Region, 2003-2026, NGI
Louisiana’s Henry Hub, the long-time national benchmark pricing hub, set two new record highs from Saturday through Tuesday, with prices around $30/MMBtu. Winter Storm Uri was the only other time since 2005 when daily prices exceeded $14, as shown in Figure 3.
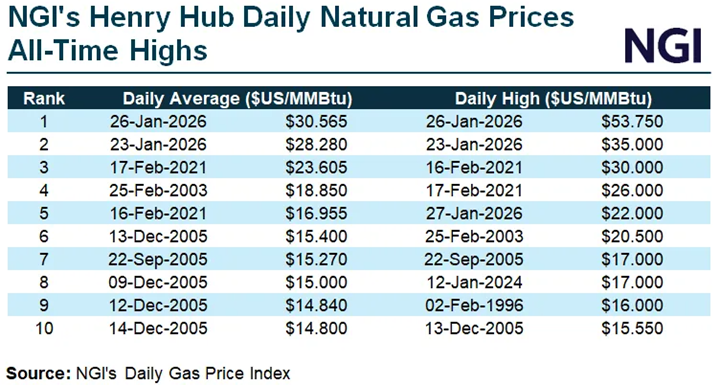
Figure 3: NGI Henry Hub Daily Natural Gas Price All-Time Highs, NGI
Forward natural gas prices were also quite volatile during this time, aligning with the gas industry’s Bidweek and the expiration of the February NYMEX contract. On January 28, the February contract’s final settlement was $7.46/MMBtu, the highest monthly price for Henry Hub since December 2022. Since then, warmer temperatures have significantly calmed the gas market, and the March contract appears likely to settle below $3.00/MMBtu.
Electricity Markets
Most electricity markets that rely heavily on natural gas-fired generation saw elevated power prices reflecting higher fuel costs. In many Northeast markets, sustained cold weather and elevated daily gas prices lasted well beyond Winter Storm Fern, driving persistently high prices into the second week of February. ERCOT, in contrast to Winter Storm Uri, was the bright spot of this winter storm, with prices rising the least and returning to normal by Thursday, January 29, as shown in Figure 4.
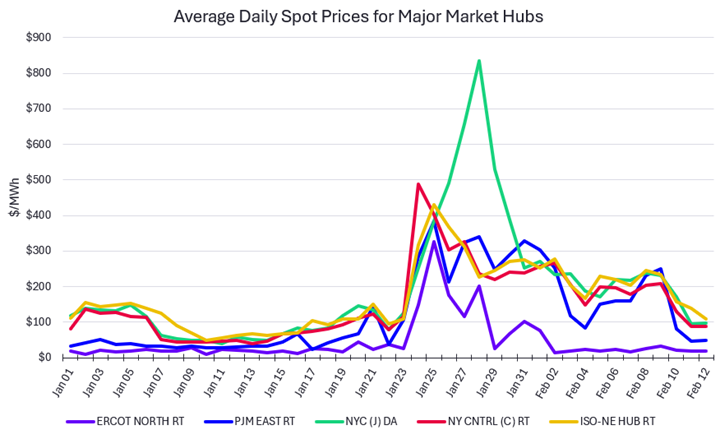
Figure 4: Average Daily Spot Prices for Major Market Hubs, 5
ERCOT
In Texas, while we saw a few hours of elevated prices, with the highest-priced hours occurring Sunday evening through Monday morning and again on Tuesday morning, Winter Storm Fern was relatively uneventful. This was unexpected, given how cold it was. With below-freezing temperatures not extending much farther south than San Antonio, electric demand peaked at 75,857 MW on Monday morning, significantly below the all-time winter peak set last year on February 20, 2025, at 80,880 MW.
The January monthly average Real-Time price for the North zone was about $53/MWh, slightly higher than the past four years. However, as shown in Figure 5, January appears to have absorbed most of the volatility, as February’s average so far has barely exceeded $20/MWh.
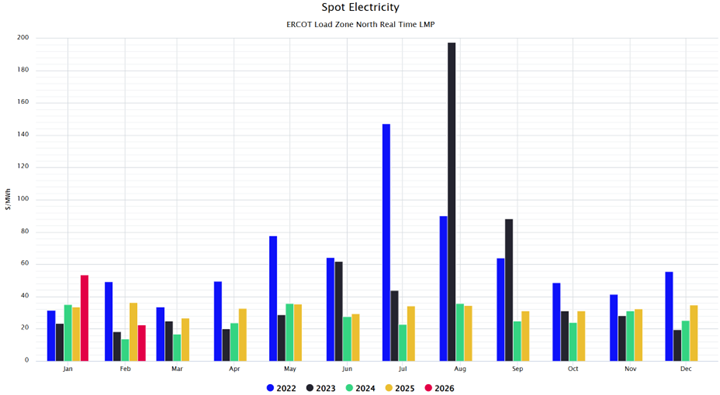
Figure 5: ERCOT North Zone Real-Time LMP Monthly Spot Electricity Prices, 5
PJM (Midwest & Mid-Atlantic)
Unlike in Texas, the elevated prices did not end with Winter Storm Fern. The average daily prices for the Real-Time and Day-Ahead markets in PJM from January 20 to February 10 were approximately $207/MWh and $240/MWh, respectively. That’s 20.7¢ to 24¢/kWh, just for wholesale power costs. As shown in Figure 6, this 20-day period, spanning both January and February, will end up making both of those months the highest Day-Ahead average winter monthly prices since January 2014.
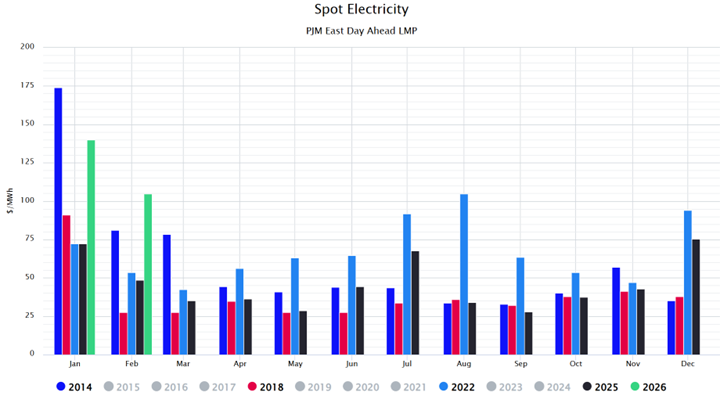
Figure 6: PJM East Zone Day Ahead LMP Spot Electricity Prices, 5
New York (Upstate & Downstate)
Upstate and Downstate New York were heavily influenced by all the same factors as PJM: high daily natural gas prices, near-continuous curtailments of natural gas to back up fuels, and peak winter demand exceeding peak forecasts. Peak demand in New York exceeded last winter’s maximum on nine separate days between January 20 and February 10, and exceeded NYISO’s forecasted peak of 24,200 MW twice, reaching 24,317 MW on Feb. 7 and 24,249 MW on February 8. Still, the results were close enough to consider the ISO’s forecast highly accurate.
As shown in Figure 7, spot prices in New York for that same January 20 to February 10 span averaged ~$293/MWh in NYC (J), ~$273 in Syracuse’s Central (C) zone, and $252/MWh in Buffalo’s West (A) zone.
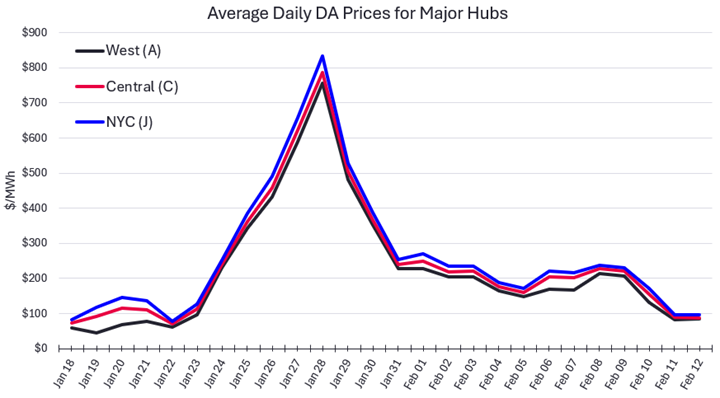
Figure 7: Average Daily Day Ahead Power Prices for Major New York Hubs, 5
As shown in Figure 8 and Figure 9, the monthly averages for Central New York (Zone C) and New York City (Zone J) exceeded the previous highest winter months, which were set in 2014, 2022, and 2025.
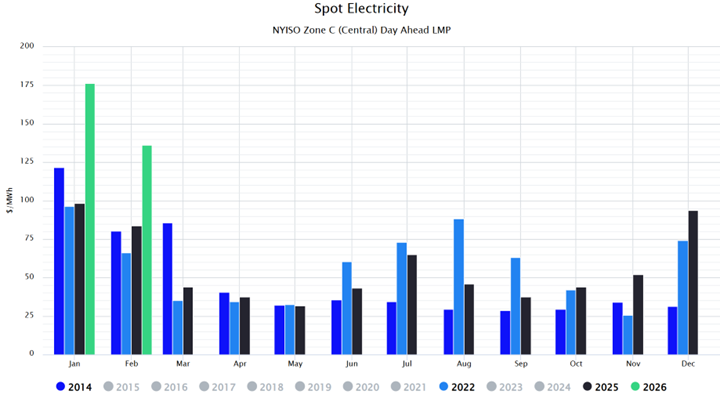
Figure 8: NYISO Zone C (Central) Day Ahead LMP Spot Electricity Prices, 5
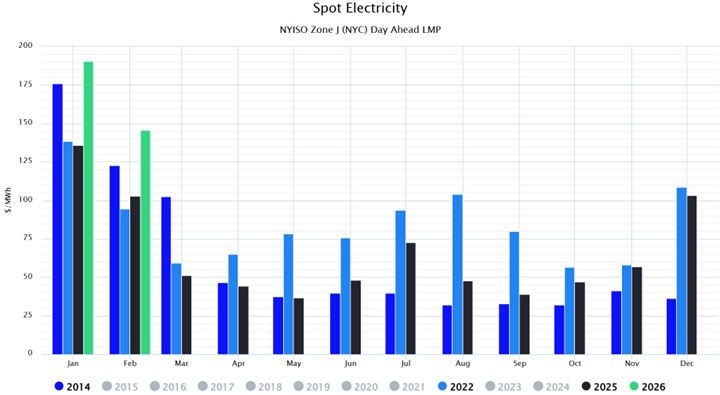
Figure 9: NYISO Zone J Day Head LMP Spot Electricity Prices, 5
New England
New England, for most natural gas pipelines, is the end of the line, the final destination of natural gas traveling through the Midwest, Mid-Atlantic, and New York. This means that if any of those other regions experience high natural gas prices, New England often does as well. The only benefit New England has over most of these regions is the Everett LNG import terminal in Boston Harbor, which can help limit the upside price risk to something close to the marginal price of LNG. Reports indicate that through mid-February, four cargos of LNG have offloaded at Everett. Even with those additional imports, daily prices at Algonquin Citygate were significantly higher this winter than the winter of 2024/25, as shown in Figure 10. Other pipeline hubs in New England, such as Iroquois' Zone 2 and Tennessee’s Zone 6, also saw record daily gas prices early in the week during Winter Storm Fern.
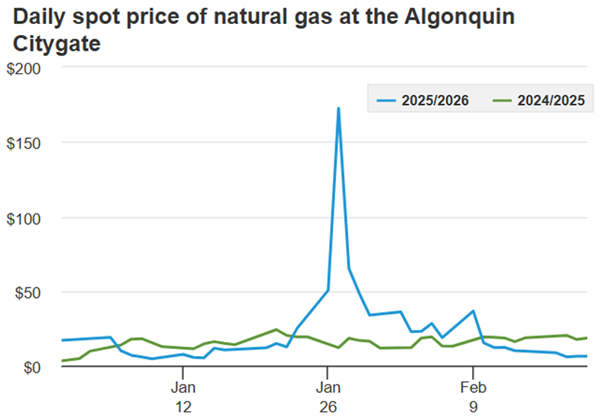
Figure 10: Daily Spot Price of Natural Gas at the Algonquin Citygate, EIA
Driven by high fuel prices, Day-Ahead and Real-Time prices escalated in New England as well with a tight correlation to fuel prices. As shown in Figure 11, Day-Ahead prices for January 20 to February 10 averaged approximately $261/MWh (26.1¢/kWh) for wholesale power only. Figure 12 shows that, historically, these were some of the highest monthly average spot prices in over a decade for the months of January and February.
 Figure 11: ISO-NE Day-Ahead and Real-Time Electricity Prices, 5
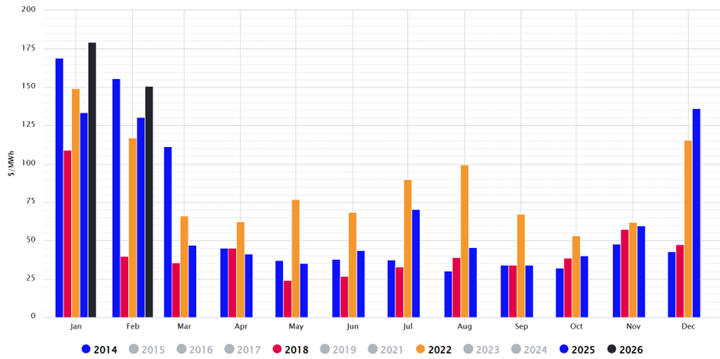
Figure 12: ISO-NE East Zone Day-Ahead LMP Spot Electricity Prices, 5
Summary
For the PJM, NYISO and ISO-NE power markets, Winter Storm Fern and the cold fronts that immediately followed it caused some of the highest daily natural gas and power prices the Midwest, Mid-Atlantic and Northeast have ever seen. Combined with sustained, relentless cold that lingered in the region for more than two weeks, this event is likely to have a lasting financial impact on these markets, even for fully hedged customers. When spot prices become this volatile, forward markets respond by assigning a higher valuation to “high-risk” weather events. Forward prices for next winter reached recent highs across all three regions immediately following Winter Storm Fern.
The exception was Texas and the ERCOT power market. There, while temperatures were significantly colder than normal in North and Central Texas, conditions were closer to normal in South Texas. The cold front stalled in Central Texas, meaning this event was not nearly the system stress test that Winter Storm Uri proved to be. Regardless of how manageable the test was, ERCOT performed exceptionally well, and forward market premiums for future winters have declined since the storm.


