With 2019 finally behind us, it’s time to reflect on how spot/index prices settled last year in Texas and then examine how those prices are shaping the current forward market.
In 2019, index prices in Texas settled at one of the highest levels over the last 10 years. Figure 1 shows that only 2011 (the year it snowed during the Super Bowl in Dallas with rolling blackouts and a very hot summer) and 2014 had higher index settlements than last year. The high index settlement price for 2019 should not be much of a surprise given the index price volatility that was experienced in August and September. Index prices in August 2019 cleared at the highest average price in the history of Texas’ deregulated electricity market, while index prices in September 2019 were at the 4th highest level in ERCOT’s history. Most of these high prices came from approximately 6 hours on August 13th and August 15th and two hours on September 22nd.
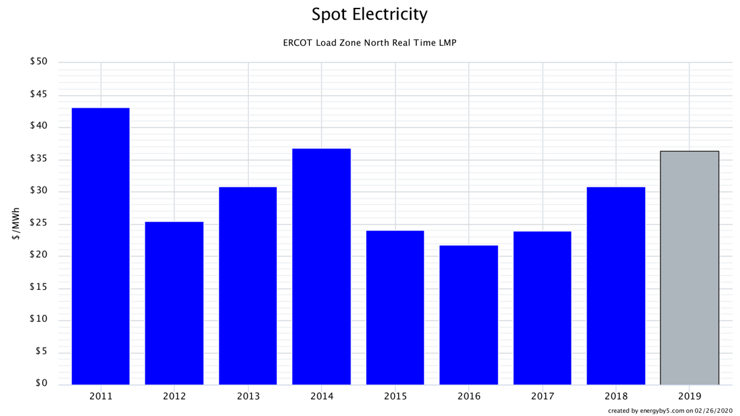 Figure 1: Spot Electricity: ERCOT Load Zone North Real-Time LMP, by 5
Figure 2 shows each of the individual monthly averages for each month in each year over the last 10 years. August and September of 2019 clearly stand out, but what is also interesting is how inexpensive the rest of the months were in 2019. Equally shocking is how inexpensive January and February of 2020 have been. Index prices for January 2020 cleared in the North Zone at an average price of about $0.016/kWh, the lowest January ever and the 3rd lowest month ever. To date, February is averaging below $0.019/kWh and is likely to settle in the bottom 6% of all monthly index prices over the last 10 years.
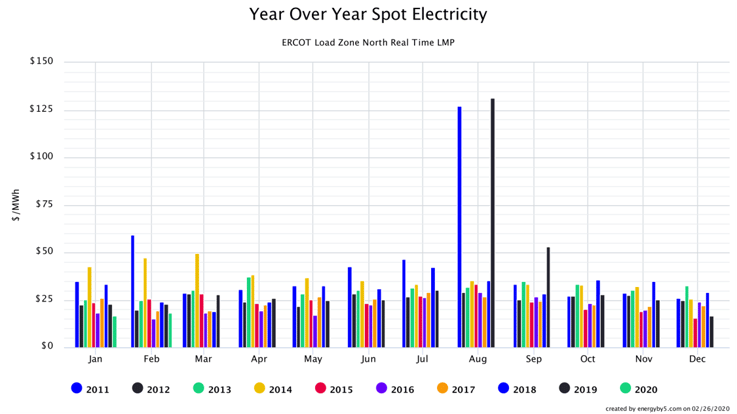 Figure 2: Year Over Year Spot Electricity: ERCOT Load Zone North Real-Time LMP, by 5
These extremely low index prices are driven by significantly inexpensive spot natural gas and excessive amounts of Off-Peak wind generation. These two factors have started to put downward pressure on the non-summer months in the forward market. Figure 3 compares forward prices for each month in 2020 to 2024 with the five-year historical range for those same months. Note that every month, excluding January, February, July and August, for the next five years is trading below the median of the 5-year historical range. In fact, many months are trading in the bottom quartile of the trading range and some are even trading below minimum settled amounts.
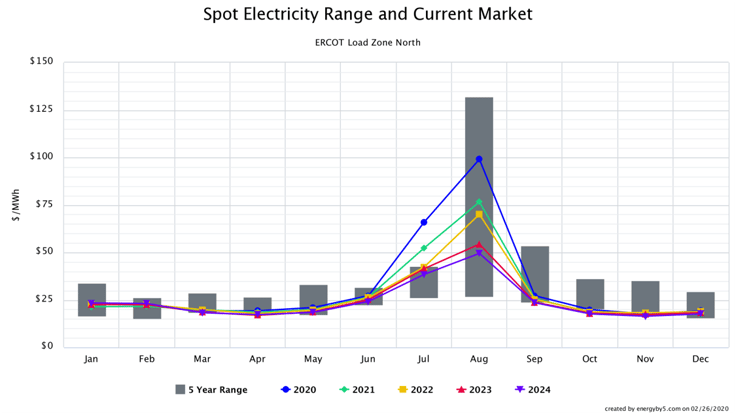 Figure 3: Spot Electricity Range and Current Market: ERCOT Load Zone North, by 5
It is also worth noting that prices for July and August get less expensive with time as prices in 2023 and 2024 are trading at discounts to 2020, 2021 and 2022. These are very strong buying signals for nearly every month in the forwards, with the exception of August 2020 to 2022. Even though prices for the prompt summers are elevated due to the events of last summer, it may be worth paying the slight premium given the potential for index prices to reach the $9,000/MWh cap during summer periods when electricity demand may exceed supplies.


