One of the biggest urban legends in the power buying process is that, clients should buy electricity during the spring or fall months because that is when prices are at their lowest. Like all legends, there is a small element of truth behind this belief - but on the whole, it is completely wrong.
TELL ME THEN, When should I buy electricity?
The spring (April to June) and fall (September to November) months are also known as “shoulder months” in the energy business. The origin of this legend comes from the observation that the individual spring and fall months tend to be less expensive than other months.
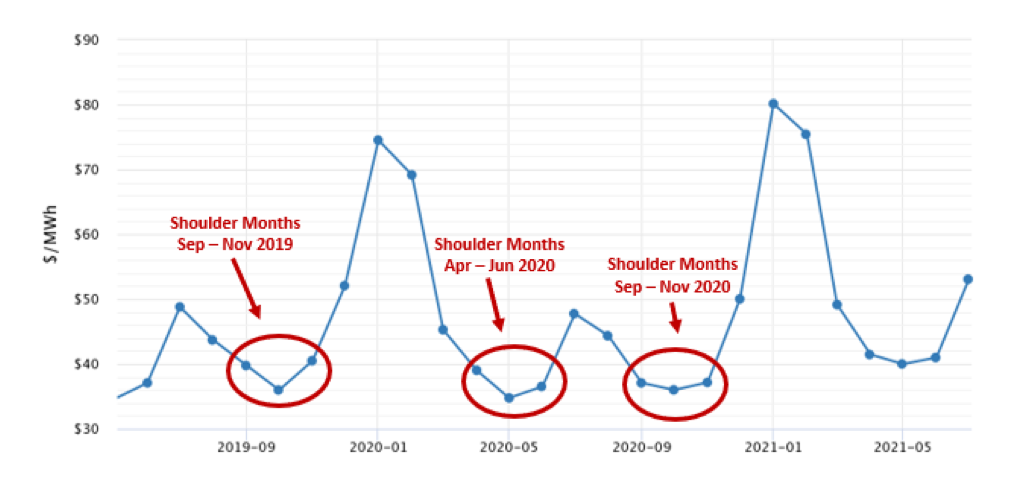 Wholesale electricity forward price curve for New York City, by 5
From the chart above, we can see that the individual shoulder months are less expensive than the other months of the year. In New York City, the winter months of December through February are the most expensive. However, when a client enters into a fixed price electricity contract, it's rarely done for a single month. The rate of a fixed price contract is the weighted average of every month within the contract term.
Forward electricity prices are driven more by market and regulatory forces than by the pricing for individual months of the year. An example is shown below.
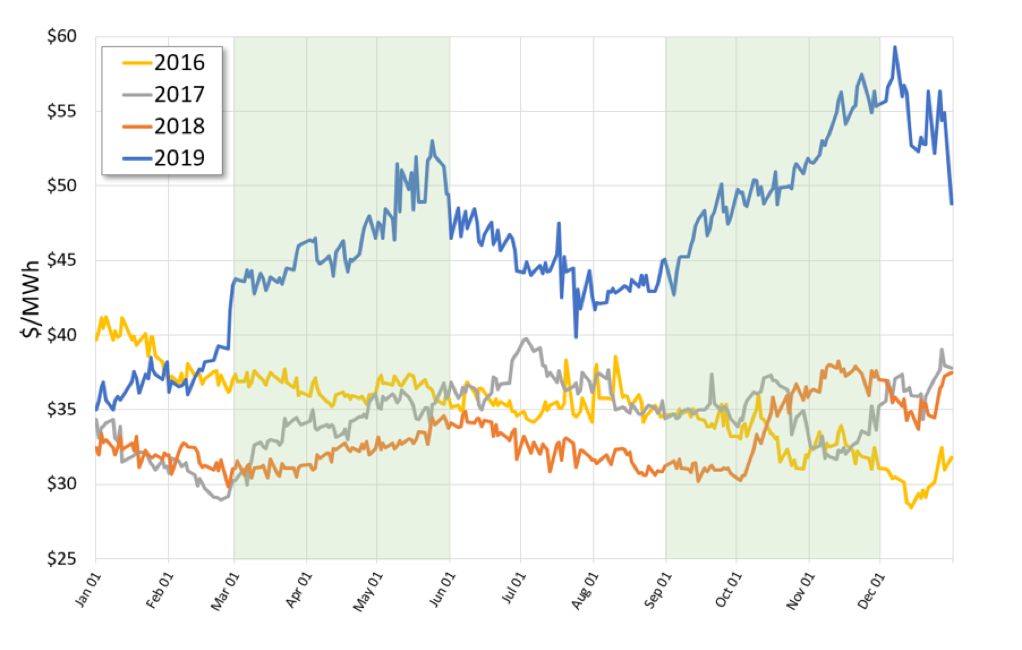 Wholesale forward electricity price curve for Texas, calendar years 2016 -2019 by 5.
Note that the wholesale price of electricity for calendar year 2019 rose during the shoulder months (shaded in green) of March to May and September through November while also declining during the peak summer months of June through August. Although not as dramatic as in 2019, there were similar prices increases during the shoulder months in both 2017 and 2018. On the whole, this chart shows that that there is no definitive seasonal correlation with electricity pricing.
While these are just two examples of energy commodity price trends, it clearly illustrates that shoulder months are not always the best months to make electricity purchases. If there were a clear and obvious seasonal correlation to buying electricity, larger market traders would have capitalized on this phenomenon long ago.


