A Two-Year Pause on Solar Projects in PJM
The geographic area served by the PJM Interconnection spans from Virginia all the way to northeast Illinois. And despite the name of the hit show, “It’s Always Sunny in Philadelphia”, this is not a particularly sunny part of the country. It may be a surprise, then, to learn that PJM is overwhelmed by applications for new solar farms. In fact, PJM is proposing a two-year pause on reviewing new generation projects (most of them solar) that seek interconnection with its power grid to slow the influx.
How did PJM, the largest competitive wholesale power market in the country, become the focus of so many solar projects? There are several factors at work that have more to do with politics and economics than with the sun and clouds. First, prices for renewable energy have come down sharply over the past several decades. These days, if you are going to build a new power plant in this country, it is more cost-effective for that plant to run on renewable energy, which is highly subsidized through the federal tax code and does not have a fuel cost associated with it. Figure 1 shows a levelized cost of energy (LCOE) analysis that was released by an investment bank in October 2021. This chart shows that the costs associated with solar and wind generating assets range from $28 to $108/MWh compared to natural gas-fired power plants, which vary between $124 and $159/MWh. It is clear that these economics apply both in the United States and in many other countries as well.
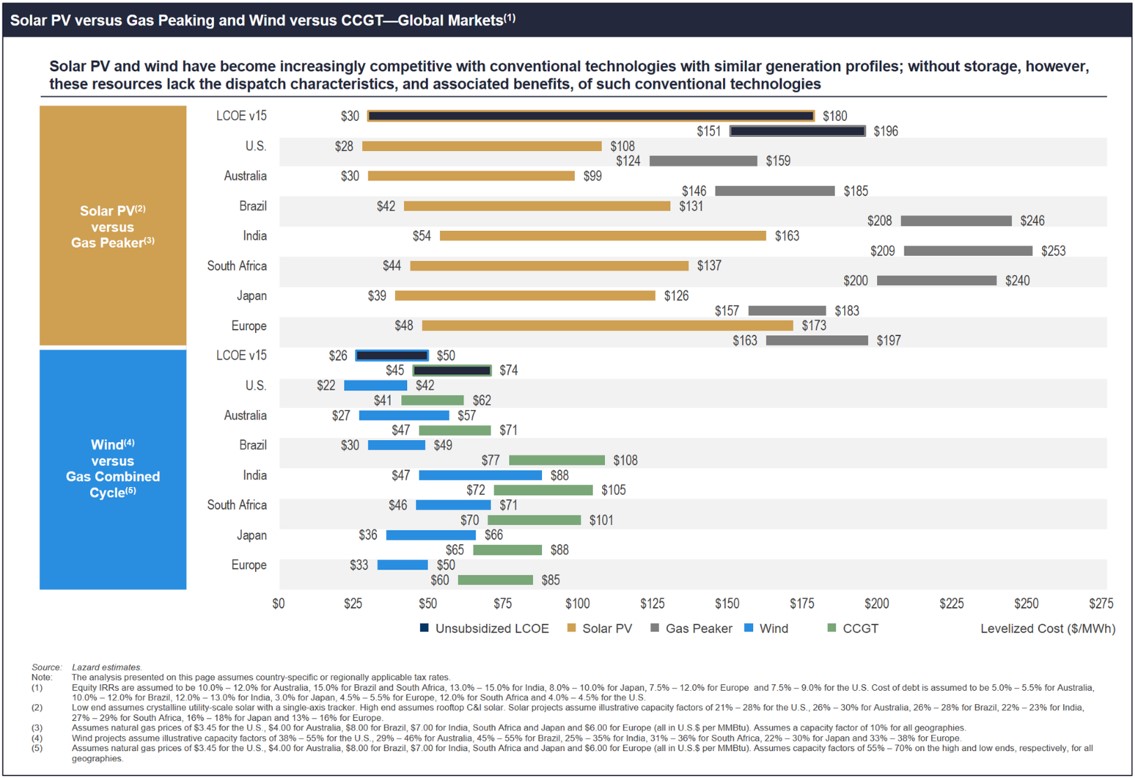
Figure 1: Solar PV vs Gas Peaking and Wind vs CCGT from lazard.com
Additionally, many states within PJM (Maryland and New Jersey, for example) have passed aggressive renewable energy and/or climate change legislation. One side effect of these policies is that it drives market prices for Renewable Energy Certificates (RECs) higher in these states, which incentivizes more renewable resource development than otherwise would have occurred. In Pennsylvania, for example, Governor Tom Wolf established that state’s first statewide greenhouse gas reduction goals in 2019. With a stroke of the pen, the solar industry in Pennsylvania took off. Now, 520 generating projects are in the queue, 437 of which are solar[1].
Another factor driving increased demand for solar projects within PJM is the growing trend of corporate sustainability. Thanks to the rise of Virtual Power Purchase Agreements (VPPAs), ESG-minded corporations can and do build renewable energy facilities in locations where it is most cost-effective to do so, regardless of where that energy is consumed, or the carbon is emitted. Figure 2 shows where a new power generation capacity was built in 2021. Note that significant amounts of new generating assets were added in the southwest and south-central plains states. But there was also plenty of activity in Virginia, Pennsylvania, West Virginia, and Ohio as well and many of those new assets were from solar projects. Corporate demand for renewable energy is only expected to increase, placing a high demand for relatively inexpensive land in the interior of the country from renewable project developers.
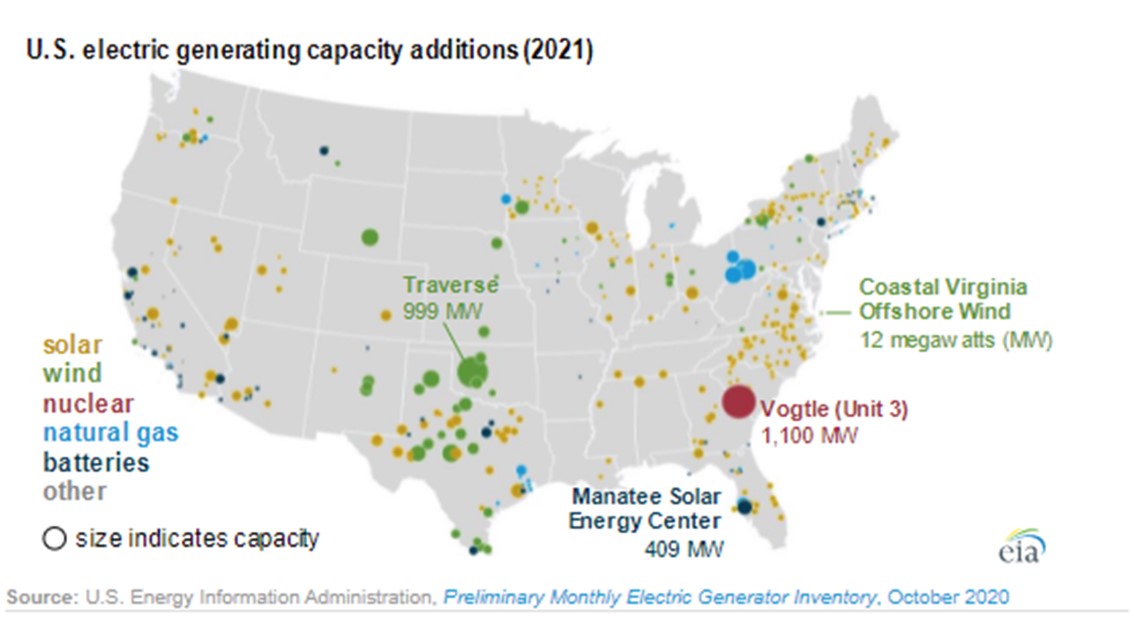
Figure 2: US Electric Generating Capacity Additions from eia.gov
How is PJM proposing to fix the backlog? With about 2,500 projects awaiting action by the grid operator, there is no quick fix. Officials are proposing an interim period with a two-year delay on about 1,250 projects already in the queue. In addition, they envision a deferral on the review of new projects until the fourth quarter of 2025, with final decisions on those coming as late as the end of 2027. Officials hope to submit their plans to the Federal Energy Regulatory Commission (FERC) by May 2022 for approval. Ultimately, whatever FERC decides is likely to end up in court, given the various stakeholders such as local utilities, project developers, grid operators, environmentalists, landowners, and other interest groups.


