On Sunday, March 8th, the NYMEX natural gas market opened at approximately $1.67/MMBtu. By the early morning hours of Marh 9th, it dropped down to almost $1.60 and ended the day up about 9¢, at $1.78/MMBtu. On Tuesday, March 10th, natural gas again rallied another 16¢ to close around $1.94/MMBtu. By Wednesday morning, the rally continued up to about $2.00/MMBtu before news around COVID-19 began to take hold, moving the market down. These market movements are shown below in Figure 1 (note that the height of the line shows the day’s range between the minimum and maximum trade prices, the height of the bar is that day’s difference between opening and closing prices, and the color of the bar indicates if the day closed up (green) or down (red) compared to the open).
We believe that the last week’s rally of almost 40¢/MMBtu was related to Saudi Arabia’s intent to increase crude oil production and exports. Initially, the thought was that more crude oil from Saudi Arabia and the expected drop in global crude prices would reduce the amount of cheap natural gas being produced in the Texas Permian Basin. However, as shown in Figure 1, gas prices have been falling since last Wednesday. Now it seems that the fears of an economic recession and less natural gas demand due to COVID-19 may be the dominant driver in lowering gas prices.
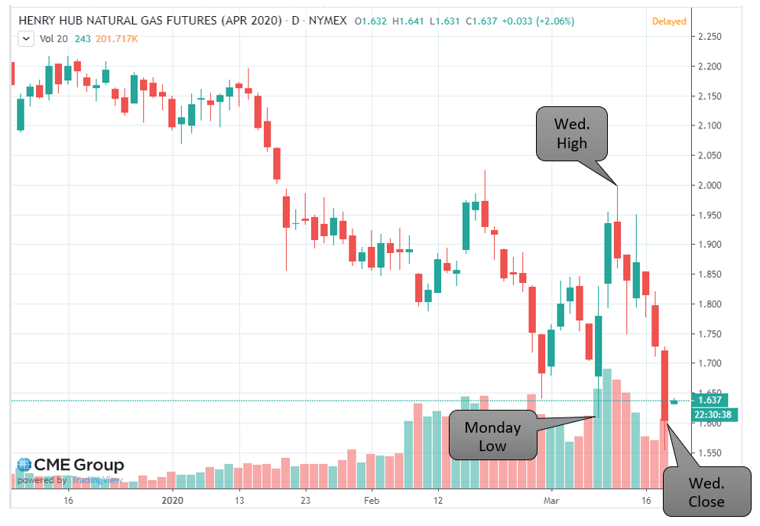 Figure 1: Henry Hub Natural Gas Futures, by cmegroup.com
Looking out further into the future, natural gas prices are also falling. Figure 2 shows gas prices for calendar years 2021 to 2026. This chart shows that for calendar year 2021, the upward movement from March 6th to March 10th was 13¢/MMBtu, while it only increased 3¢/MMBtu for calendar year 2026. Additionally, the downward movement since March 10th for 2021 has only been 5¢/MMBtu, while prices for 2026 have dropped by 10¢/MMBtu. This is flattening the forward curve, making each step up, from one year to the next, less expensive. This is also an odd market movement if one believes that the largest driver of energy markets over the last couple of days has been tied to the concerns around a short-term economic slow-down.
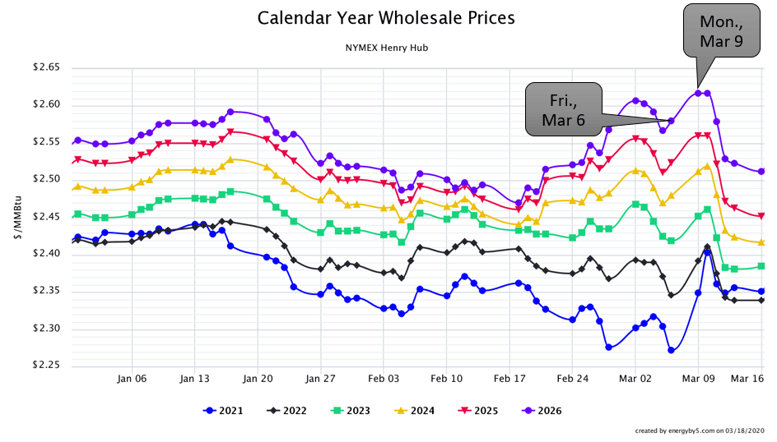 Figure 2: Calendar Year Wholesale Prices NYMEX Henry Hub, by 5
5 will be hosting three webinars this month where members from our team will discuss natural gas and electricity markets and how the coronavirus may affect the force majeure terms in energy contracts. To register please click on the link(s) below.
PJM (PA, NJ, MD, DC, OH, IL) Webinar: 3.24.20 @ 11AM ET
NYISO (New York) Webinar: 3.24.20 @ 2PM ET
ERCOT (Texas) Webinar: 3.25.20 @ 11AM CT


