
Our head of analytics and Sr. Zoltar, Eric Bratcher, is a big lover of the Summer Olympics, especially the less popular sports. On Tuesday this week, while Eric was watching ERCOT’s load again come in under forecast, women’s skeet shooting was on in the background. Eric was glued to the final round as USA’s Amber English held off Italy’s reigning champ to win her first gold medal in the event. An hour later, USA’s Vincent Hancock set an Olympic record of 59 of 60 targets, winning his event and being awarded with his third gold medal.
 Eric reflected on his amazement as he watched the speed and skill these athletes demonstrate in hitting the quickly moving targets. If you have ever had the opportunity to shoot skeet, with the multiple targets flying from both your right and left side simultaneously, you’ve likely experienced extreme frustration of a double-miss and the sheer excitement of knocking down two. Eric’s team has felt similar emotions forecasting the ERCOT 4CP days this summer. Skeet shooting and 4CP predicting both involve quickly moving targets and multiple variables that seem to increase in difficulty throughout the competition.
Over the past few years, we’ve witnessed the growing impact of large commercial and industrial (C&I) customers in ERCOT curtailing their electricity demand on anticipated 4CP days, typically beginning around 3:00 PM. The amount of load removed from the grid by these large users is getting to be significant enough (more than 2,000 MW) that the act of their curtailment alone is enough to shift the monthly maximum demand to another day.
Last month, during a moderate heat wave, ERCOT called for energy conservation during the week of June 14 through 18, anticipating a record demand for June and possibly a record summer demand. This led most forecasters to call a possible 4CP day which resulted in a strong amount of load curtailment. So strong in fact that on June 14, load actuals came in almost 4,000 MW under forecast.
The opposite happened the next week, on Wednesday, June 23, a day that was not forecasted to set the monthly coincident peak. When industrial load did not curtail that day but opted to curtail instead on the 24th and 25th, the 23rd ended up setting the maximum day of the month. Figure 1 shows each day’s peak demand, with the gray shaded days being consensus 4CP warning days by multiple 4CP forecast service providers.
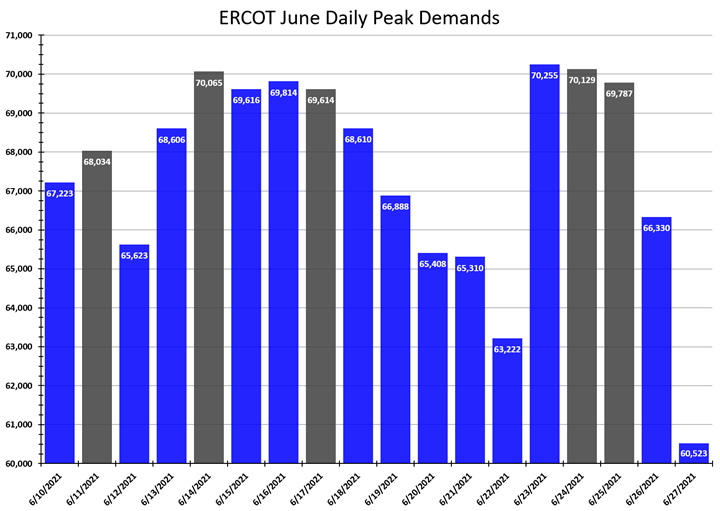
Figure 1: ERCOT June Daily Peak Demands from 5
One of the most telling days during the month was June 26. Even with load from the 23rd known at 70,255 MW, the load forecast for the 26th was so much higher that most believed the 26th had a high chance of setting the maximum demand, only to again be driven down by 4CP load curtailment after the notifications were sent.
July’s values were a little easier to hit, with most of the month having unseasonably cooler temps across the state, until this week when temperatures finally crested above 100 degrees in multiple cities. Even with few potential 4CP days left in the month, we are still shooting at moving targets as daily actual loads deviate greatly from their day-ahead forecasts thanks to ongoing curtailments in the C&I sector. For example, on the 26th (Figure 2) and 27th (Figure 3), load flattens dramatically after 3:00 PM (Hour 15). However, when comparing those two days (where the market widely anticipated a 4CP day to occur and load was curtailed) to the control in the experiment where 4CP was not anticipated, the load shape is dramatically different (Figure 4).
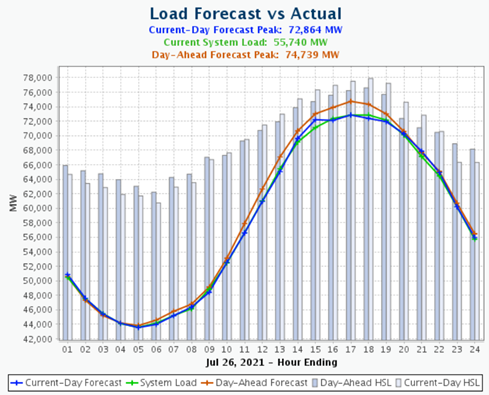
Figure 2: Load Forecast vs Actual for July 26, 2021, from ercot.com
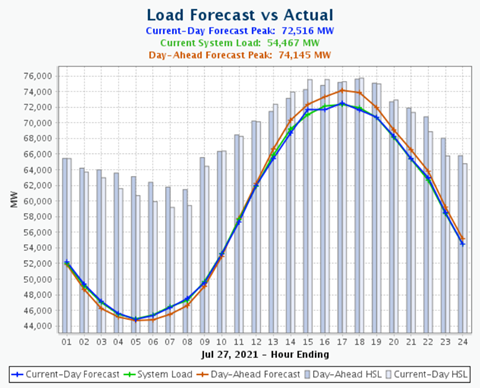
Figure 3: Load Forecast vs Actual for July 27, 2021 from ercot.com
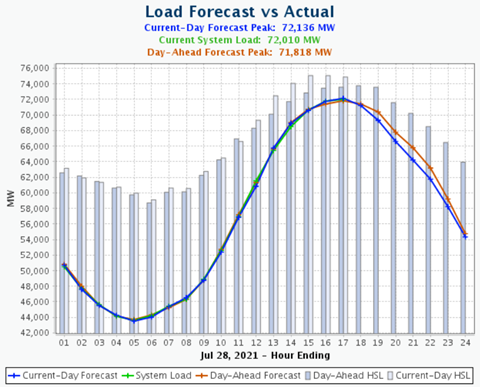
Figure 4: Load Forecast vs Actual for July 28, 2021, from ercot.com
As transmission charges associated with 4CP continue to climb, and as more C&I customers continue to curtail their usage on predicted 4CP days, it has become even more difficult to predict the true 4CP day. We are now in a new world where significant load reacts to the forecasters’ call for curtailment, which in turn causes that day’s load to underperform. The more we try to participate in 4CP avoidance, the harder it is to hit the target.
Who knows, perhaps mastery of 4CP prediction could land you in the next Summer Games representing the USA.


