
Market Info & Updates

Topics: Natural Gas
Industries: All industries
While it has become common over the last few years for the bears of the natural gas market in the US to rule the month of December and drive down the coming winter’s (January and February) contract, this fall it seems like December came early. For almost the entire month of November, warmer-than-normal weather forecasts, both weekly and monthly, have been relentless for any traders holding on to long positions. Since Halloween, the Dec. ’23 – Feb. ’24 strip has dropped about 75¢, from $3.65 down to $2.90 per MMBtu as shown in the blue line in Figure 1. This chart also shows that prices have fallen for the April 2024 to November 2024 strip (black line) over the last several weeks.
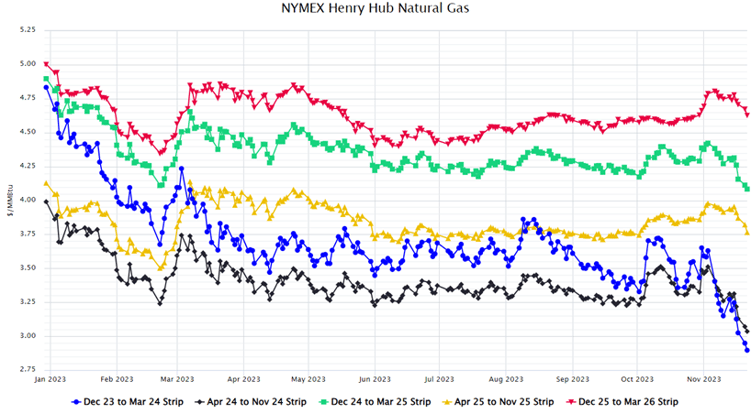
Figure 1: By 5
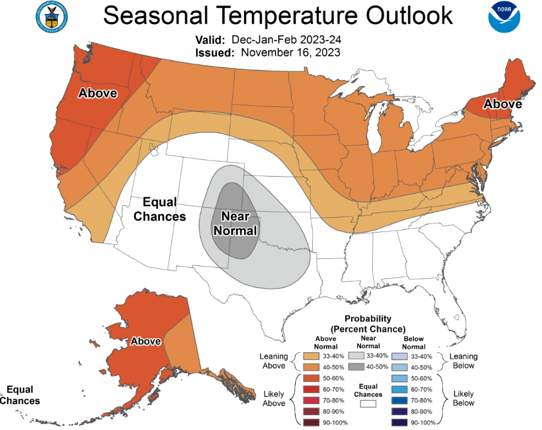
The main driver of this sell-off has been all the warm weather in the forecasts, most reaffirming the typical, strong El Niño pattern of warmer-than-normal temperatures for the northern half of the country, and cooler to neutral temperatures for the southern half.
While this year’s “early-winter sell-off”, as shown in Figure 2, is becoming more common, this year joins the two COVID years of 2020 and 2021 where prices started to fall in early November, instead of the more typical, weather-driven selloffs in the middle of December. This allows for two probable outcomes over the next three to four weeks of trading.
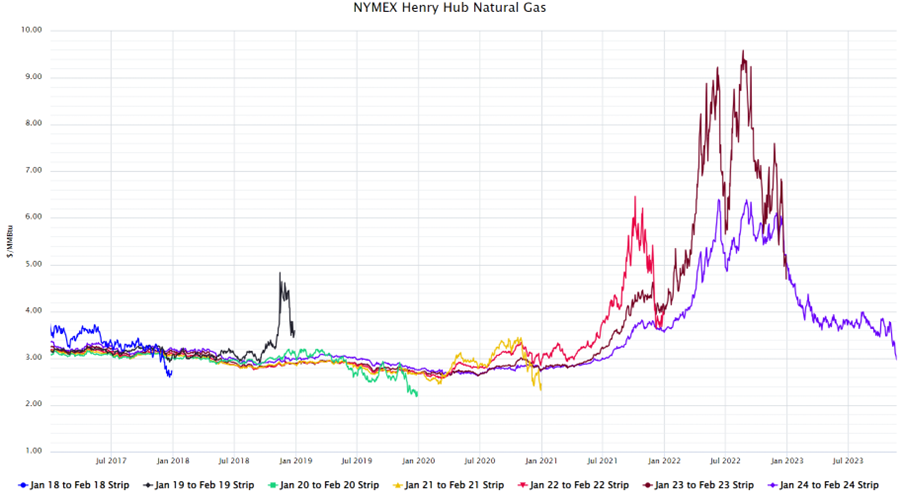
Figure 2: By 5
In one scenario, either the market decides the premature sell-off has run its course and the market rebounds, or it continues its sell-off and looks for a new support level (floor) for the January contract. As of the publication of this post, the winter strip (January and February) was trading around $2.95/MMBtu. Figure 3 shows that in the past 10 years, only three winter strips have settled below $3.00: 2016 at $2.28, 2020 at $2.01, and 2021 at $2.61. While there may be some room for current prices to continue to fall and find its floor, it is unlikely that there is more than 50¢ to 75¢ to the downside. In another scenario, the market may find a floor in early to mid-December, and forwards rebound from their massive November decline. In either scenario, it will be a lot easier to play Monday-morning quarterback in early March to evaluate how low this market will go, and just how much risk premiums are included in a forward winter strip trading below $3.00/MMBtu in this current market. With these bullish trends, it is likely a wise decision to make a purchase now for any open positions because history has shown that one bad winter weather event can spoil a good market opportunity.
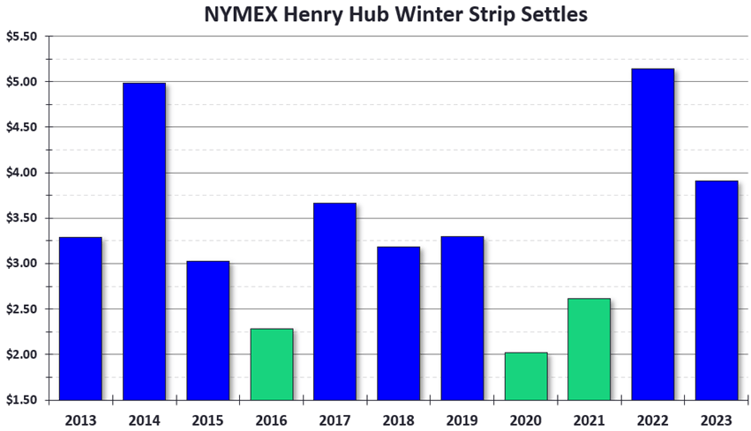
Figure 3: By 5

 Nov. 17, 2026
What El Niño and LNG costs could mean for winter energy prices
 Oct. 9, 2026
Winter 2026-27 Outlook for Gas and Power Markets: 5 Things to Know from our Live With 5
 Sept. 10, 2026
Buy or Wait? Why Waiting is Also an Energy Buying Strategy
 April 27, 2026
What the Middle East Conflict Means for Energy Markets
 Feb. 24, 2026
Stress Test: How Winter Storm Fern Moved Energy Markets
 Feb. 24, 2026
Watts Next? 2025 Lessons and 2026 Predictions
 Dec. 9, 2025
The Coming Surge: What Large Energy Users Need to Know About 2026 Electricity Prices
 Aug. 20, 2025
August 2025 - Energy Market Letter
 April 25, 2025
Locking in Energy Rates Now Could Benefit Your Business
 Jan. 14, 2025
WINTER POWER OUTLOOK: RELIABILITY & RISK ASSESSMENTS ACROSS KEY MARKETS
 Aug. 29, 2024
SUMMER 2024 MARKET REVIEW
 June 26, 2024
How Hurricanes Affect Energy Prices