
May 2020 it is likely to be the 5th month in a row where Real-Time LMP (spot) prices in New York City (NYISO Zone J) have settled at their lowest levels in ten years. Figure 1 shows the monthly settlement price in Zone J from 2011 to 2020. Note that the first five months of 2020, shown in the dark green line, are less than all other monthly settlement prices.
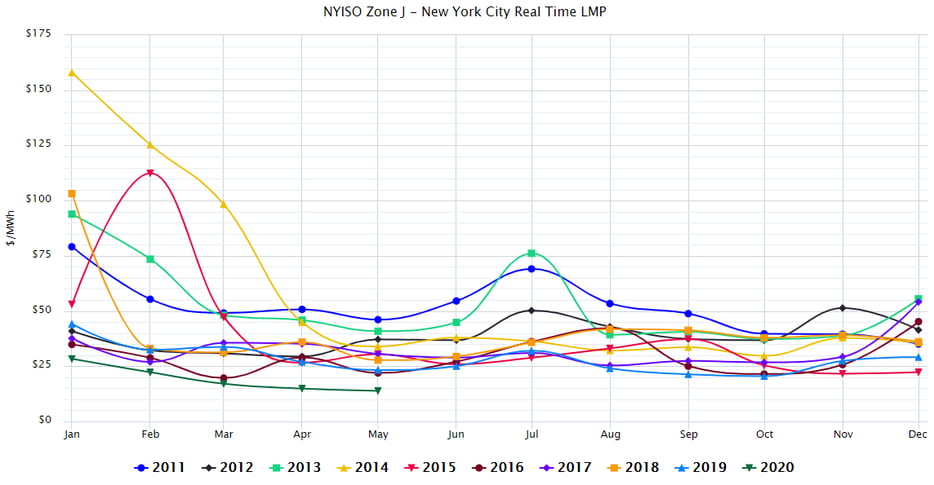 Figure 1: New York City Real-Time LMP, by 5
Three factors that have contributed to these historically low index settlement prices. These factors have collectively caused wholesale energy prices to fall significantly below levels that create any economic incentives to replace New York’s aging fleet of generation with newer, cleaner forms of electricity.
The first factor driving these historically low prices has been the mild winter. Bitter cold fronts from January through March typically create volatile spot natural gas prices, as additional electricity generating assets are brought online to keep up with heating demand. Note that the highest spot prices in January to March were observed in 2013, 2014 and 2015, which were also the three coldest winters in the last ten years. Spot electricity prices in New York City were kept in check over the first quarter of 2020 by mild temperatures.
Another factor driving down spot prices in New York City has been the large amounts of natural gas that have been placed into storage. Natural gas production in the United States has remained strong and producers have been placing large amounts of gas into storage over the last 12 months. A mild winter meant that demand was reduced, and less natural gas was withdrawn from storage to keep up with the winter heating season. High levels of supply coupled with lower demand drove spot prices to their record lows in February and March because most of the downstate electricity generation comes from natural gas-fired power plants.
Finally, the economic slowdown from COVID-19 created a supply and demand imbalance. As businesses in New York City began to shut down in March, the amount of electricity supply exceeded the demand. This demand destruction began in March and continued through April and May. This has continued to depress spot prices in New York City.
While these three factors are working to keep energy prices down, capacity prices in New York have been rising. Capacity market prices are established through multiple auctions held by the New York Independent System Operator (the NYISO is the entity that manages the electricity grid in the State of New York) in two six-month strips: the Summer (May – October) and the Winter (November – April).
The first of three auctions that set the price for this summer’s capacity was held last month. The auction price for capacity in New York City cleared at an all-time high of $18.36 per kW per month, while upstate capacity prices cleared at a more modest price of $2.71 per kW per month. Figure 2 shows the prices for capacity in New York City (blue line) and the rest of New York State (red line “NYCA”). A customer in New York City with a 40% load factor (utilization factor) can expect to see an increase of approximately 2¢ per kWh this summer due to these higher capacity costs.
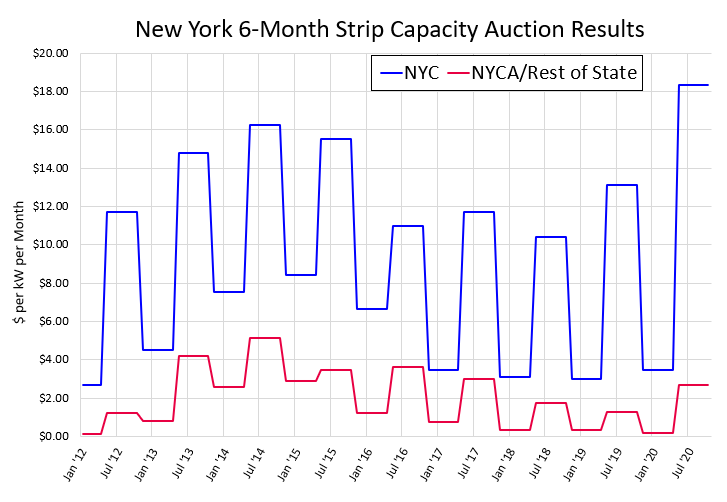 Figure 2: New York 6-Month Strip Capacity Auction Results, by 5
Clients in New York City on utility default service or an index/spot energy price product and floating capacity with a third-party supplier will likely lose most of the savings realized over the last five months because of higher capacity charges this summer. Upstate clients will not see the same dramatic increase as those downstate, but will still see slightly higher capacity prices this summer, compared to the last two summers.


