
Since fall officially arrives next week, we‘d like to review what happened in New York’s energy markets over the summer. Two stories are worth mentioning:
- Peak electricity demand in New York, which sets all business’ capacity obligations, likely occurred over the weekend of July 20, 2019
- Low spot natural gas prices kept Real-Time electricity prices in check all summer throughout the state
This summer, the grid’s peak hour was likely set on the afternoon of Saturday, July 20, 2019, from 5:00 PM to 6:00 PM. The peak electricity demand during those hours was 30,397 MWs. During that weekend, temperatures on both days were approximately 96º in New York City, which turned out to be the hottest days of the entire summer (See Figure 1). And even though this peak occurred over a weekend, that will likely be the peak hour for 2019. This is important because an electricity meter’s usage at that peak hour is how the NYISO determines the capacity requirements for all electricity customers in the state. This is significant because businesses that were not operating over that weekend may see reductions in their capacity charges for the period of May 2020 through April 2021. Residential customers may not see the same benefit because most homes use the most amount of electricity over the weekend.
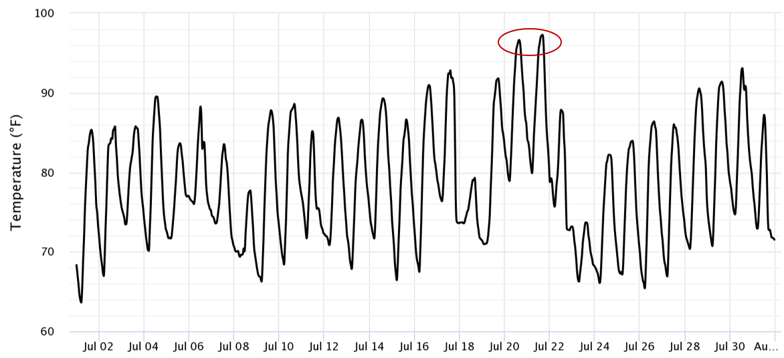
Figure 1: July Temperatures in NYC, by 5
LMP Prices
In terms of Real-Time prices, not much happened as there was little volatility across most of the state throughout the summer. Figure 2 shows how Real Time prices varied from April through August in the nine electricity zones (labeled A through K) in New York State. All monthly averages were below 4.0 ¢ per kWh for all zones for all months, except Zone K (Long Island), which for July, settled just above 4.2¢ per kWh. The average monthly settlement prices for all NYISO zones are summarized in Table 1.
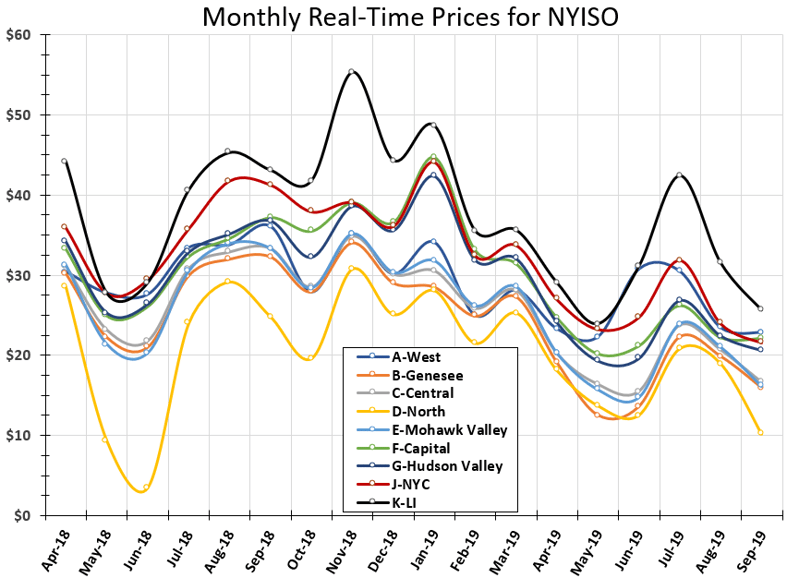
Figure 2: Month Real-Time Prices for NYISO, by 5
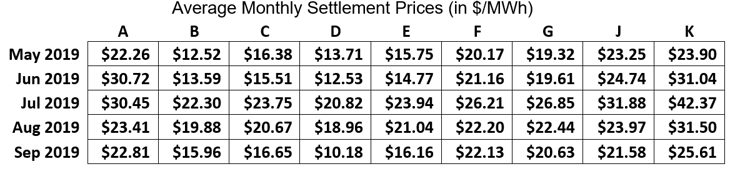
Table 1: Average Monthly Settlement Prices, by 5
The low daily settlement price of spot natural gas prices in New York was one of the main reasons why there was little volatility in spot electricity prices. On many days during the summer, daily natural gas prices settled below $2.25 per MMBtu. And since natural gas-fired generators tend to set wholesale electricity prices, it is not surprising that the power markets follow gas prices. These low spot gas prices kept electricity prices in check throughout the summer of 2019.


