The team at 5 has spent many months, complemented by countless charts, graphs, and blog posts, discussing the rising prices and volatility in the energy markets. When you spend so much time in the weeds, the bigger picture becomes cloudy. In this reflection, we step back to highlight the fundamental shift that has happened in the marketplace over the last year. Shifts of this magnitude do not happen often, perhaps once every ten years, and they need to be called out.
This fundamental shift involves how natural gas prices are set and influenced. It’s important to remember that as natural gas goes, so goes electricity. Natural gas is still the dominant marginal fuel in most deregulated markets. This means that natural gas power plants tend to set the price for electricity in most hours. Therefore, when we talk about changes in the natural gas markets, we are also talking about similar changes in the power markets, due to this correlation.
A Little History Lesson:
If you wanted to know what was happening with natural gas and electricity prices in the early days of deregulation, the key was to track crude oil markets. Recall that back in 2006 the US imported about 60% of our oil, allowing global events (demand/supply, war, political squabbles, etc.) to have a waterfall effect on oil, natural gas, and power prices. Around the summer of 2008, that relationship diverged, as seen in Figure 1. There were many causes for this shift including material demand changes for oil and gas, new gas field discoveries, and new exploration technologies, such as fracking and horizontal drilling.
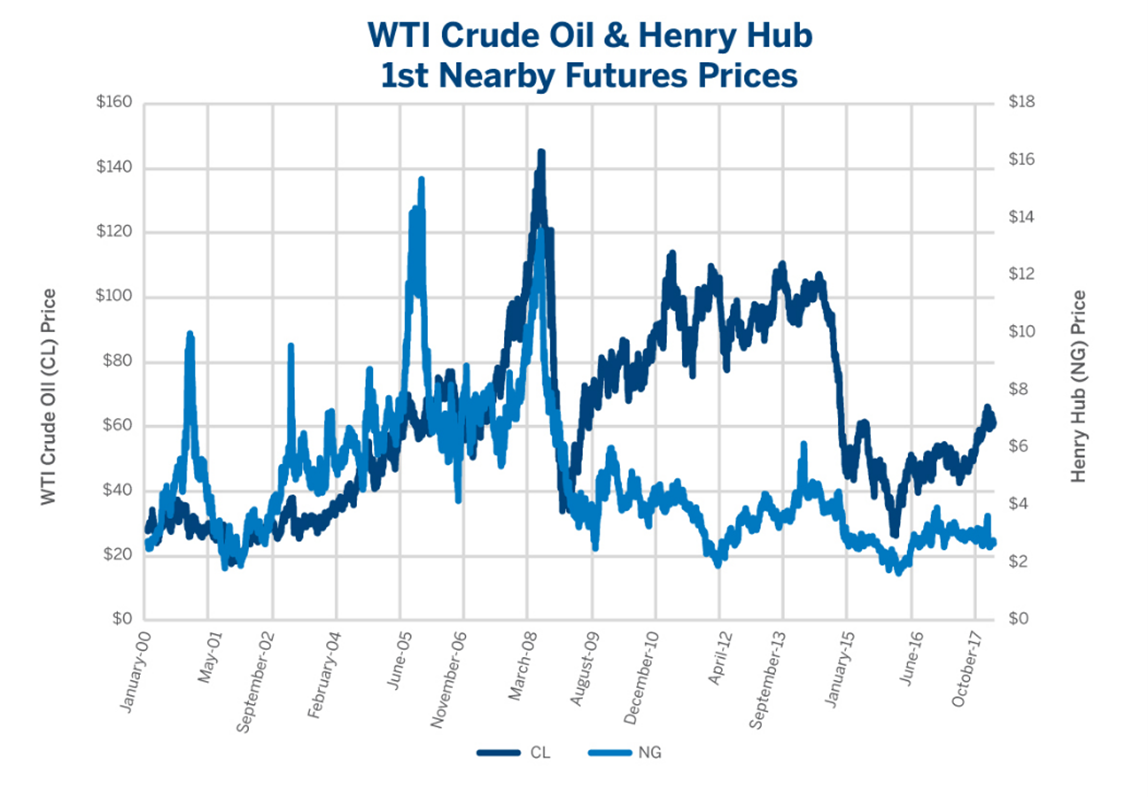 Figure 1: WTI Crude Oil & Henry Hub 1st Nearby Futures Prices from cmegroup.com
It was at this point that natural gas shifted from being linked to a globally influenced commodity like oil to a domestic one. And times were good. The fracking boom that followed brought an abundance of natural gas and plummeting prices. By 2015, the US became the world’s largest producer of natural gas.
Then a funny thing happened on the road to energy independence - the global push to reduce carbon, also known as “The Energy Transition”. More and more countries began shifting from coal or oil generation to natural gas. In fact, the global demand for natural gas is up 22% since 2010. In the last year and a half, that demand has outpaced supply, resulting in dramatic price increases. In some recent months, the price for Liquefied Natural Gas (“LNG” - the form of natural gas that is cooled to a liquid state and transported in tanker ships where no pipelines exist) across the globe has been 25 times more expensive than what we pay here in the US for natural gas.
As is our strength, US energy companies took notice of these trends. Several had the foresight to expand pipelines to Mexico or build LNG export terminals in recent years. Those companies can now take advantage of this global disparity in prices via natural gas exports. The downside is those activities reduce domestic supplies and again link the US price of natural gas to the global markets. As long as the relevant governments around the world allow this importing/exporting, the global natural gas markets will seek price equilibrium. That is, the US will keep exporting natural gas until the price differential no longer demands it. The chart in Figure 2 shows how domestic natural gas production and exports have increased dramatically over the last ten years.
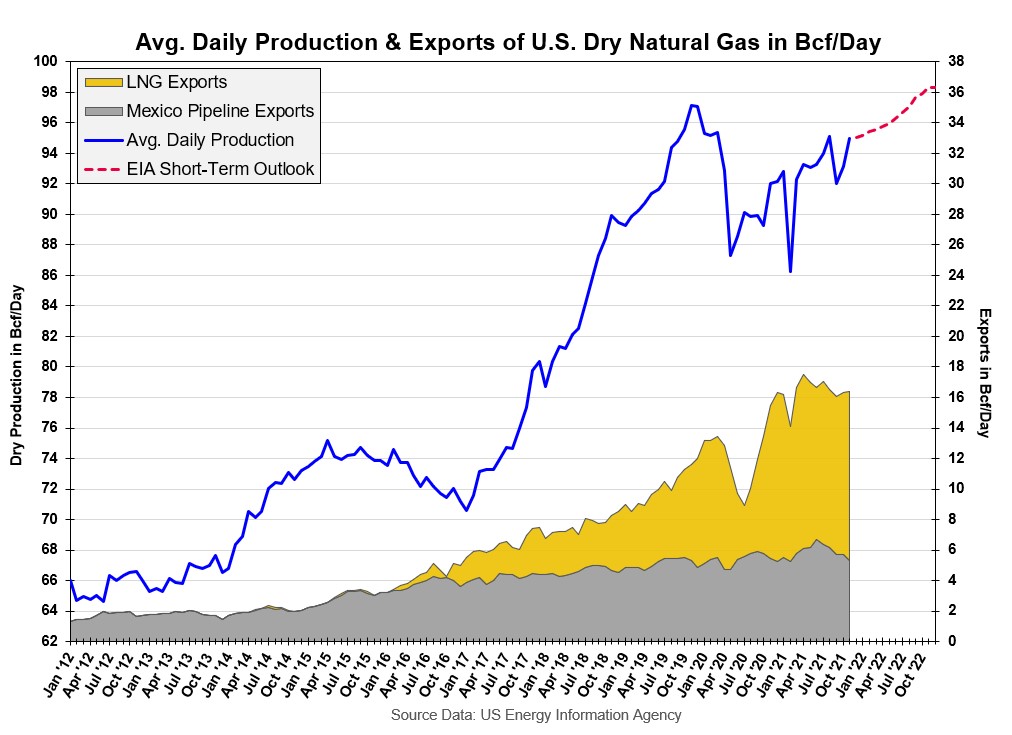
Figure 2: Avg Daily Production & Exports of US Dry Natural Gas from 5
So, we’re back. The US is back on the global stage when it comes to managing natural gas and electricity. Natural gas prices have once again shifted from a domestically influenced commodity to a global one. That is a shift we all should appreciate and absorb into our energy management strategies going forward. If the wind is down off Scotland, or Russia slows natural gas deliveries to Europe, or China’s economy revs up, it impacts domestic natural gas prices and, therefore, electricity prices. Whether this fundamental shift towards globalization is here to stay depends on dozens of factors, but it is here now and must be acknowledged.
What does that mean to us, the consumers and managers of energy cost and risk? More global players and more politics mean more uncertainty, and that almost always equals more price volatility. Thankfully, our energy markets are mature enough to provide various tools and techniques to manage greater volatility. But, as always, we must know what our goals are and then how to apply those tools to achieve the highest return. It will take some education and rethinking of old strategies, but there is an opportunity in volatility as well. We’ll climb that hill together. The team at 5 is here to help.


