.png?width=800&height=400&name=2023%20CP%20Update%20(3).png)
Given that we are halfway through July, we thought it would be appropriate to provide an update on how major power markets have performed as they relate to each ISO’s coincident peak demand management program.
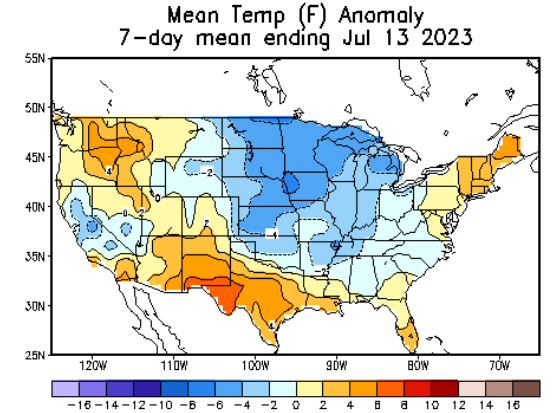
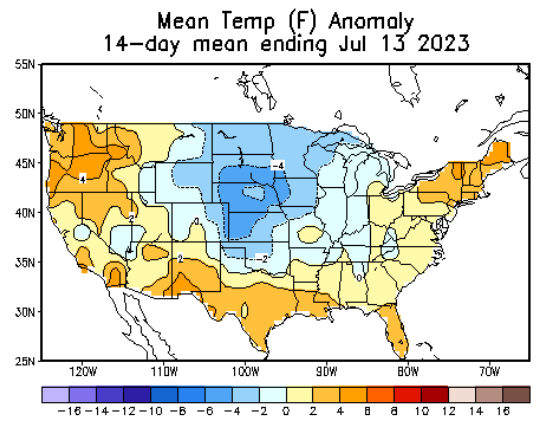
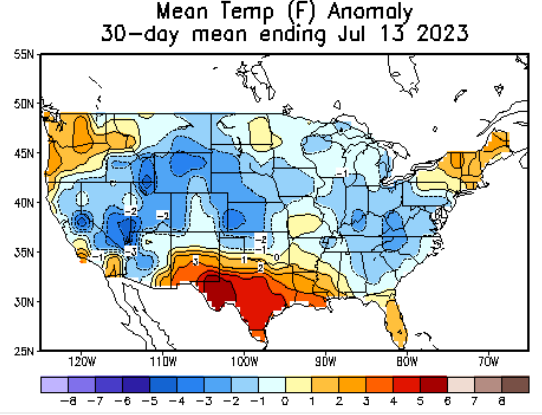
So far, both weather and demand on the PJM and NYISO grids have been mild compared to recent summers and average summer temperatures. The mean temperature, compared to the average over the last thirty, fourteen, and seven days for the period ending July 13, is shown in Figures 1, 2, and 3 below. These charts show that summer has not really arrived in the middle of the country and that temperatures in the Northeast are only 2º to 3º F above the average.

Figure 1

Figure 2

Figure 3
Mild summer temperatures have translated into relatively low Day-Ahead and Real-Time prices in both PJM and NYISO. This means a slow start to the Coincidental Peak demand management programs in both ISOs. So far, the highest demand days in PJM and NYISO are not even close to the levels where those grids historically peak. This, coupled with low forecasted temperatures over the next few weeks, means forecasting this summer’s peak demand day might be more challenging.
In PJM, the lowest of the five highest demand hours in each of the last eight years has never been less than 139,500 MW. This summer, the highest demand day was on July 5, when the grid peaked at 137,861 MWs. Since June 1, No other day has been above 135,000 MWs in PJM.
It’s a similar situation in the NYISO. Typically, that ISO’s peak demand is above 30,000 MWs, and this summer, the NYISO is expecting a peak demand this summer above 32,000 MWs. So far, the highest demand day on the grid occurred on July 6, when it peaked at 28,051 MWs or about 87% of the forecast. For power generators anywhere north of Texas, to say that the summer has been underwhelming would likely be taken as an understatement.
This situation in ERCOT is completely different. As shown in Figures 1, 2, and 3, temperatures in Texas are all some shade of red, meaning that temperatures have been higher than average. ERCOT not only broke the all-time electricity demand record in June, it also broke the all-time record set last July. Prior to this summer, the June record demand was 76,803 MW. ERCOT broke that record 10 times last month, with a new record of 80,986 MW set on June 27. July has kept the streak alive with five days above 81,000 MW. Currently, July 18 holds ERCOT's peak demand record of about 82,600 MW.
Even though temperatures are higher than normal, from a pricing perspective, spot prices in ERCOT have been relatively stable. Despite record electricity demand across the state this summer, June 20 was the only day with prolonged prices at the system-wide offer cap of $5,000/MWh, which drove that day’s average Real-Time price up to $930/MWh as shown in Figure 4. Low wind output in the afternoon and early evening hours of June 20 was the likely driver of high spot prices that day. Figure 4 shows that all other days since June 1 have seen modest spot price increases in the afternoon hours with no days averaging more than $175/MWh.
.png?width=1600&height=900&name=Electricity_ERCOT_Load_Zone_Houston_Real_Time_LMP%20(1).png)
Figure 4: By 5
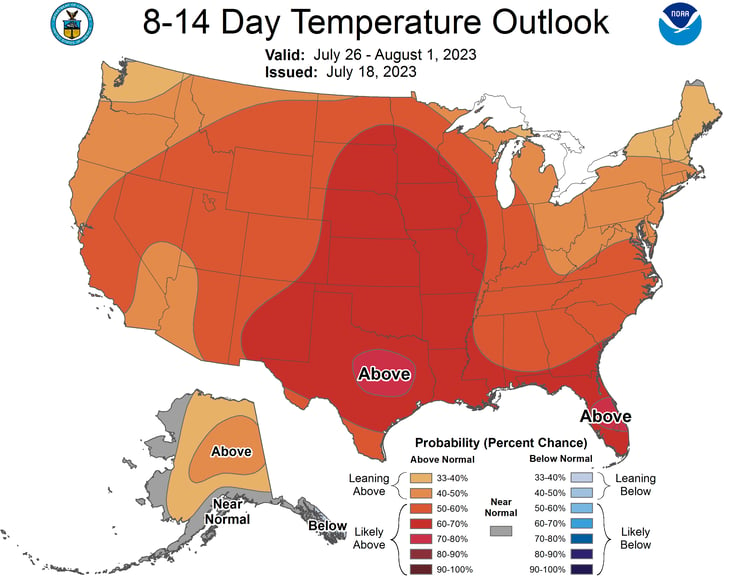
For the last week of July and early August, NOAA’s Climate Prediction Center is expecting warmer weather to start to move into the Midwest and East Coast (See Figure 5). This would suggest that PJM and NYISO could start to set some peak demand days over the next couple of weeks, but we are still less than a month into the dog days of summer and a lot can happen between now and Labor Day.

Figure 5


