
An In-depth Comparison of Winter Storm Landon Versus Winter Storm Uri
Earlier this month, the first big test of the post-Uri Texas electrical grid was blowing south across the plains. Many had legitimate concerns given the forecasts of freezing rain in West and North Texas, along with sub-freezing temperatures as far south as San Antonio. Temperatures in Houston were even forecasted to be below 30ºF for several hours in the morning on Friday, February 4th, and Saturday, February 5th.
While ERCOT was expecting the demand on the grid on Friday morning to exceed 74,000 MW (a value that would have surpassed the previous record set on February 14th last year by over 4,000 MW), the storm turned into a snoozer. The biggest news was that Winter Storm Landon did not affect the electricity grid as many had expected. And that alone is good news. It is also worthwhile, however, to evaluate this latest winter storm in comparison to last year’s winter storm and the many changes that occurred in its aftermath. The grid is in a different place today versus January 2021, and the Landon temperatures were much warmer than those experienced during Uri.
ERCOT Grid and Weather Comparison - 2021 vs. 2022:
-
Winterization: While winterization of power plants and facilities has always been an option, the increased legislative penalties and increased inspections have added new pressure. Prior to this past December, all power plants in Texas were inspected by ERCOT, with a full report submitted to the Public Utility Commission (PUC) and legislators. On January 18, 2022, Brad Jones, the interim CEO of ERCOT said, “The Texas electric grid is more prepared for winter operations than ever before,” after reporting that 321 of 324 generation and transmissions facilities passed their state inspections. And while we cannot compare that to prior years (since those inspections have not previously taken place) we can reasonably assume these new inspections improved the readiness of the state’s electricity grid over last year.
-
ERCOT Reserve Procurements: As shown in Figure 1, prior to last summer, ERCOT typically procured between 1,500 to 2,000 MW of non-spinning reserves, and about 3,000 MW of spinning reserves throughout the winter months. On February 4th and 5th of this year, spinning reserves averaged about 3,600 MW and 4,200 MW respectively, while non-spinning reserves averaged 7,300 MW on February 4th and over 8,000 MW on February 5th. The average power plant size in Texas is under 1,000 MW, which means ERCOT had the equivalent of over 11 power plants worth of backup power generation in reserve, waiting to be called. This large contingent of reserves gave ERCOT a significantly larger margin of error this winter compared to last year.
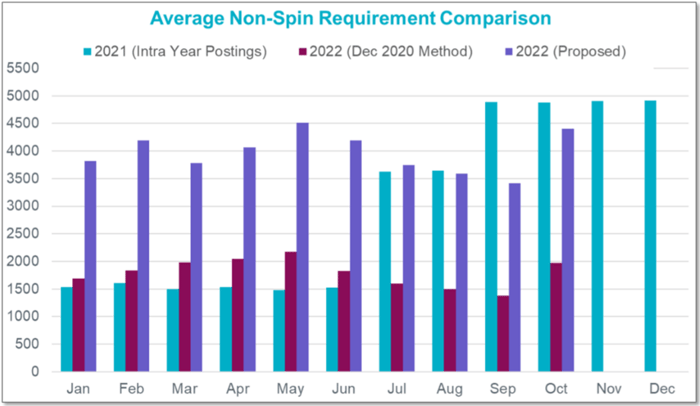
Figure 1: Average Non-Spin Requirement Comparison from ercot.com
Other Weather Comparison: Uri vs. Landon
-
Uri’s dramatic cold bought temperature extremes that parts of Texas have not experienced since 1989 or beyond. Temperatures in Dallas were near 0ºF, San Antonio was below 10º F and Houston was close to 12º F (See Figure 2).
-
Landon’s temperatures were milder, not as extreme, and less prolonged. Temperatures in Dallas were only around 20ºF, while San Antonio reached 21ºF and Houston was near 27ºF (see Figure 3). These are all between 15º and 20º warmer than Uri.
-
Frozen precipitation was also significantly lighter this year compared to last, with the fear of ice build-up on West Texas wind turbine blades this year failing to materialize. This allowed wind generation to remain strong in West Texas, while wind speeds along the coast were also significantly above day-ahead forecasts.
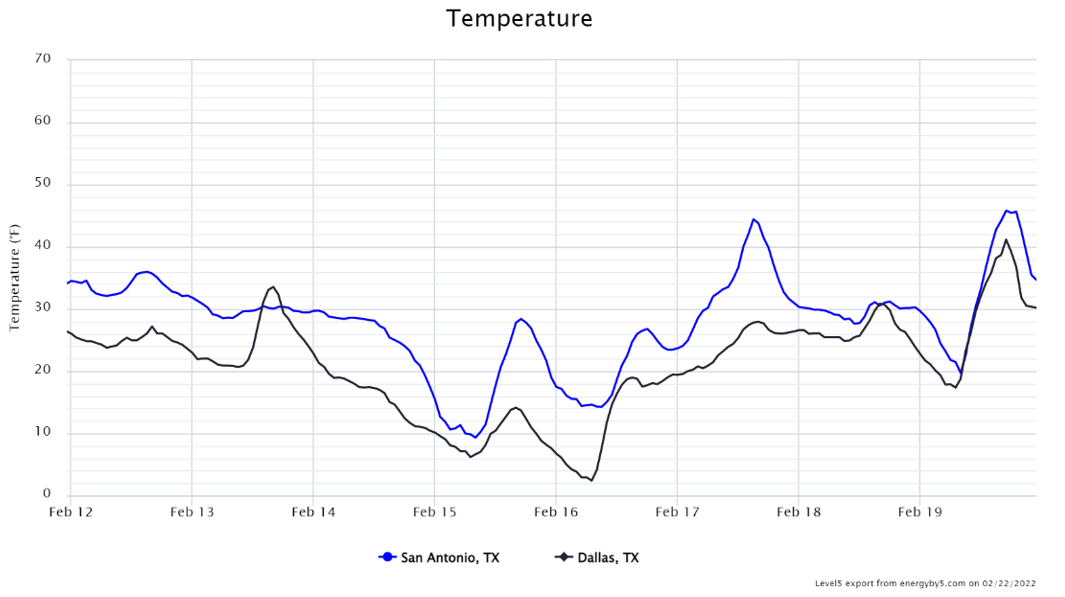
Figure 2: Temperatures in San Antonio and Dallas during Winter Storm Uri from 5
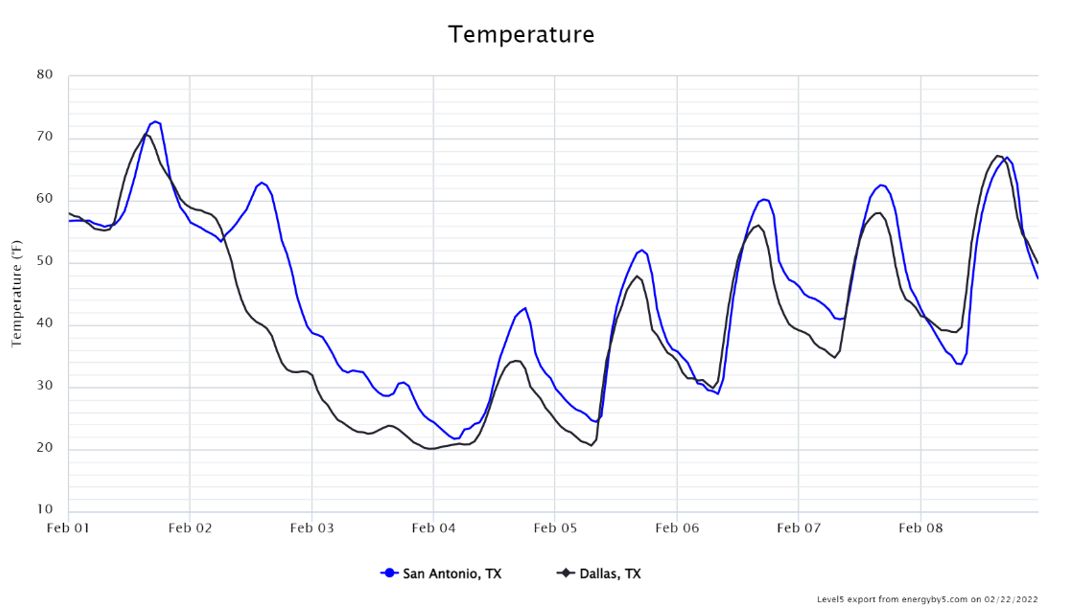
Figure 3: Temperatures in San Antonio and Dallas during Winter Storm Landon from 5
In examining the average daily temperatures in Dallas over the last decade (Figure 4), the extreme and sustained cold weather experienced during Winter Storm Uri is easy to spot. Winter Storm Landon, however, is hidden within “the noise” and looks a lot like any other cold winter day, as seen in Figure 4.
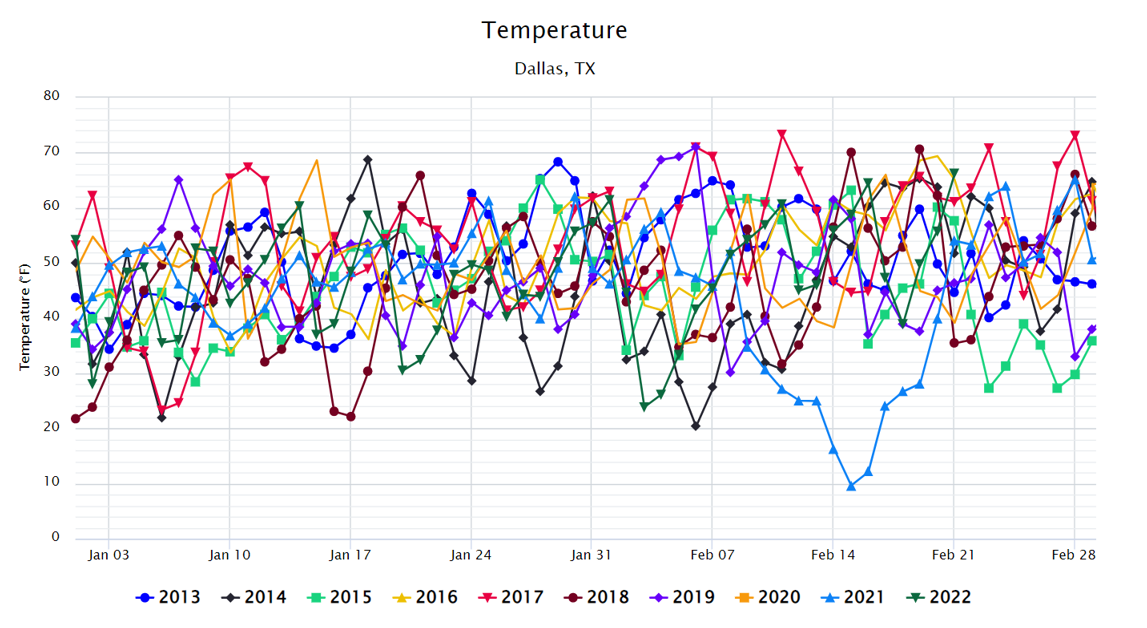
Figure 4: Average Temperatures in Dallas between 2013 to 2022 from 5
While Landon was a test, it was not significant. Rather, it seems like Landon was an easier version of the original exam, given after a severe failure on the first attempt. And yes, while ERCOT’s grid is more prepared, that does not mean that all of the problems are fixed. Nor does it mean that forward ERCOT winter market prices should sell off after this most recent winter storm. The opposite has actually happened. Since mid-January, forward winter prices in ERCOT have slowly risen, but that is mostly due to rising natural gas prices, and not from any dramatic shift in the collective thinking of traders on future winter scarcity.


