Global LNG (Liquified Natural Gas) prices, similar to global crude prices, have struggled this year. The price of West Texas Intermediate Crude (crude oil’s benchmark index) bottomed out at -$37 per barrel on April 20th, rebounded by June to approximately $30, and then recovered to about $40 per barrel for most of the summer. While LNG’s Japan Korea Marker (JKM, a major LNG index) significantly decreased, it did not go into negative territory like crude oil. However, unlike crude oil, the JKM index had a much longer sustained low, and when including the cost to liquify the natural gas, the price for LNG was essentially negative.
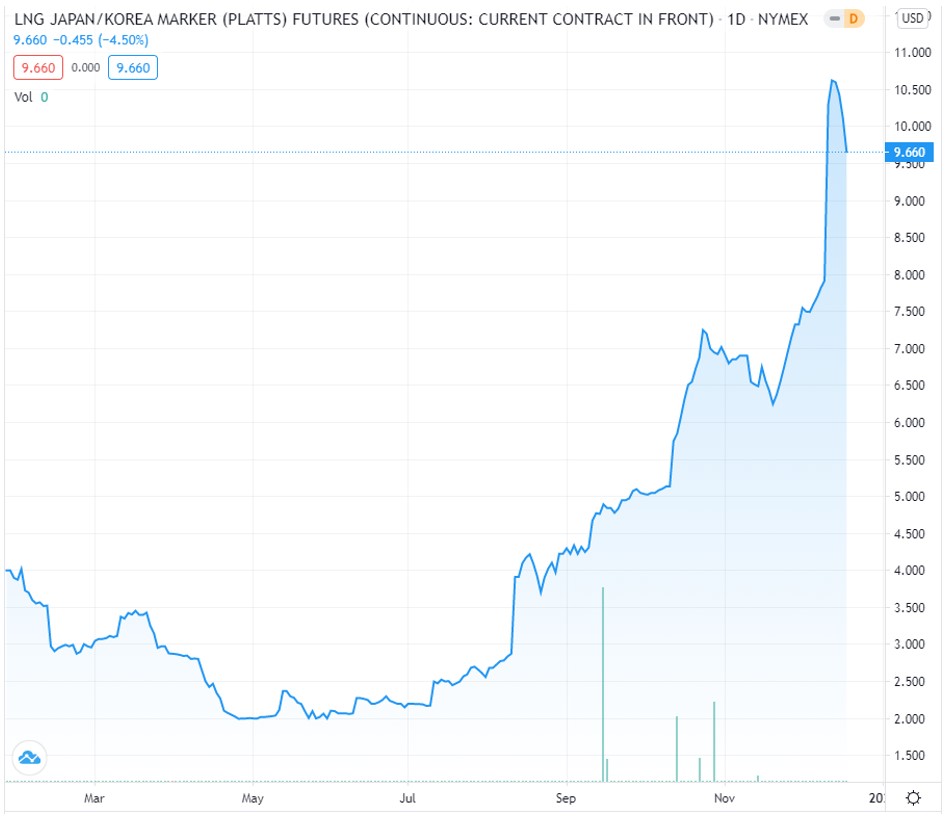
Figure 1: LNG Japan/Korea Marker Futures from cmegroup.com
The price for the prompt month LNG contract decreased to approximately $2.00 per MMBtu by late April and stayed below $3.00 until mid-August as shown in Figure 1. Typically, long-term contracted prices to liquify gas are around $3.00 per MMBtu, making an LNG spot price below $3.00 unsustainable and financially devastating on the industry. Given the downward pressure on the price of LNG, exported quantities out of liquification facilities on the Gulf Coast dropped significantly. Figure 2 shows that by June, average daily LNG exports had dropped from the pre-coronavirus high of 9.5 billion cubic feet per day (Bcf/d) to a low of 3.3 Bcf/d in July.
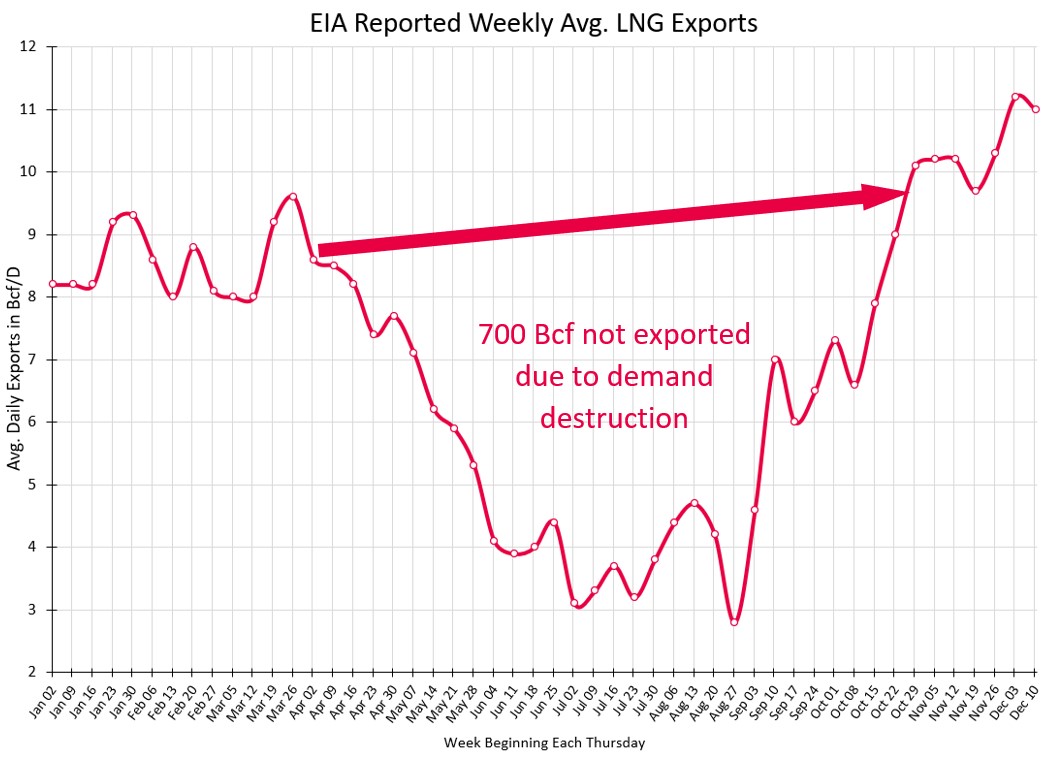
Figure 2: EIA Reported Weekly Avg. LNG Exports from 5
Figures 1 and 2 show that there has been a notable recovery in both the quantities and prices of LNG exports over the last four months. In November, average daily exports were above 10 Bcf/d, and in December those exports averaged over 11 Bcf/d. During this same rally in quantity, prices for the prompt month (next forward month) climbed up to a high of $10.62 on 12/14/2020.
Approximately 700 Bcf natural gas was not exported between April and October due to the economic slowdown caused by the coronavirus. The demand destruction for gas, coupled with lower exports, contributed to higher natural gas inventories. As shown in Figure 3, the difference between total natural gas storage inventories at the end of this injection season (3,920 Bcf) and the record low (3,189 set in 2018) was 731 Bcf. Essentially, the 700 Bcf of gas that was not exported for LNG helped what might have been close to a record low inventory level turn into a near record high inventory heading into this winter.
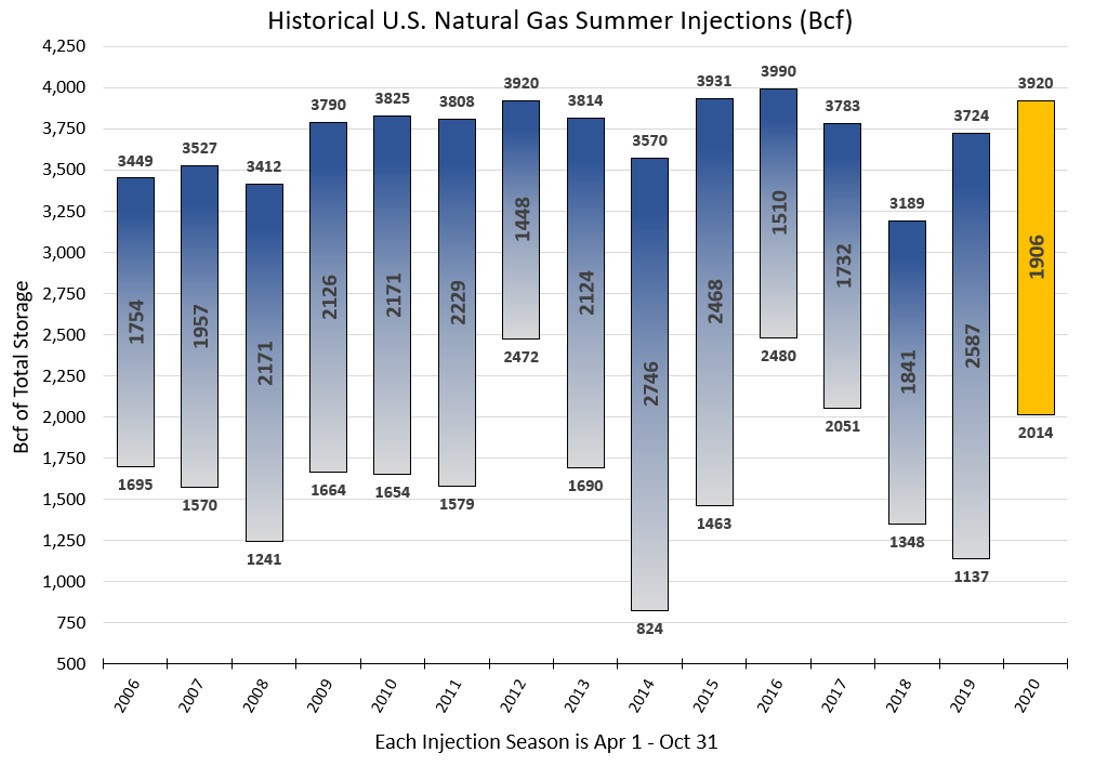
Figure 3: Historical US Natural Gas Summer Injections (Bcf) from 5
What happens next? With natural gas production still about 6 Bcf/d below January’s quantities and LNG exports fully recovered and setting new export records, analysts are looking for the point when storage levels are low enough to start putting upward pressure on NYMEX Henry Hub (the US benchmark for natural gas) prices. With gas prices for calendar years 2022 through 2024 still all trading between $2.65 and $2.50, it is hard to view those prices as overvalued. From a risk management view, we feel those years are very attractive for making purchases as the upside market price risk is significantly higher than the downside risk.


