With the Atlantic hurricane season officially opening June 1st, its time to address the annual concern “What will this year’s hurricane season do to natural gas prices?”
Back in the 1990’s, hurricane tracking was one of the most important fundamentals energy traders watched. The destructive capabilities of a powerful hurricane in the Gulf of Mexico heading towards the large production regions (Corpus Christi TX to Mobile AL) would cause drilling and production platforms in the Gulf to evacuate their personnel, typically requiring the well to be closed. This would result in a dramatic reduction in the amount of natural gas produced for a week or more if there was substantial damage to the platforms.
The technological change that solved this problem for the offshore platforms wasn’t in the platforms itself. Instead, the major adoption of horizontal drilling and hydraulic fracturing provided access to major onshore shale reserves, specifically the Marcellus and Utica shale formations in the Appalachian Region and in multiple locations throughout Texas.
The dramatic growth in the low-cost development of natural gas in onshore shale reserves has had a negative impact on the economics of offshore drilling, greatly reducing the output of natural gas from wells in the Gulf of Mexico.
Figure 1 shows the total offshore natural gas production by month over the last 20 years. Some of the major hurricanes (≥ Category 3) that crossed the predominant production region of the Gulf of Mexico are highlighted on the chart, showing the historical impact these storms had on monthly natural gas production in the Gulf.
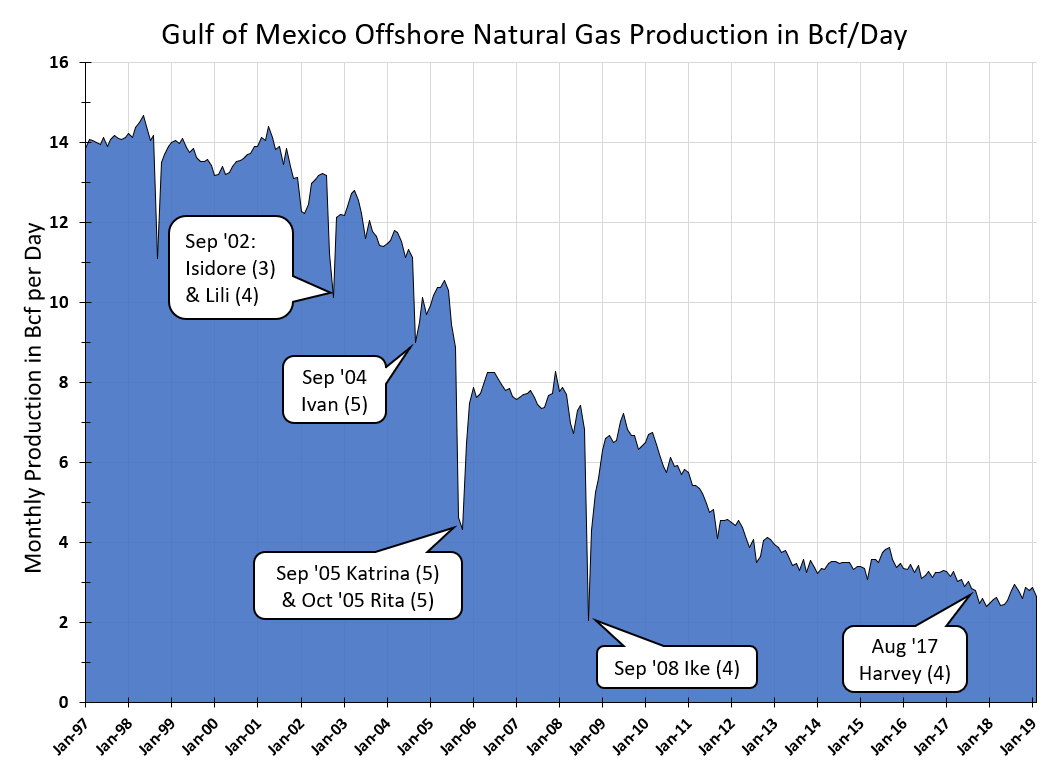 Figure 1: Gulf of Mexico Offshore Natural Gas Production Graph, by 5
One can see that total production declined steadily from 2001 through 2014, with a slower decline since 2014. This chart also shows that the dramatic drop in gas production in the wake of storms Katrina, Rita and Ike were not replicated for Hurricane Harvey in August 2017.
Figure 2 looks at the total monthly U.S. production of natural gas since 2003, with three major hurricanes and their impact to total natural gas production for that month.
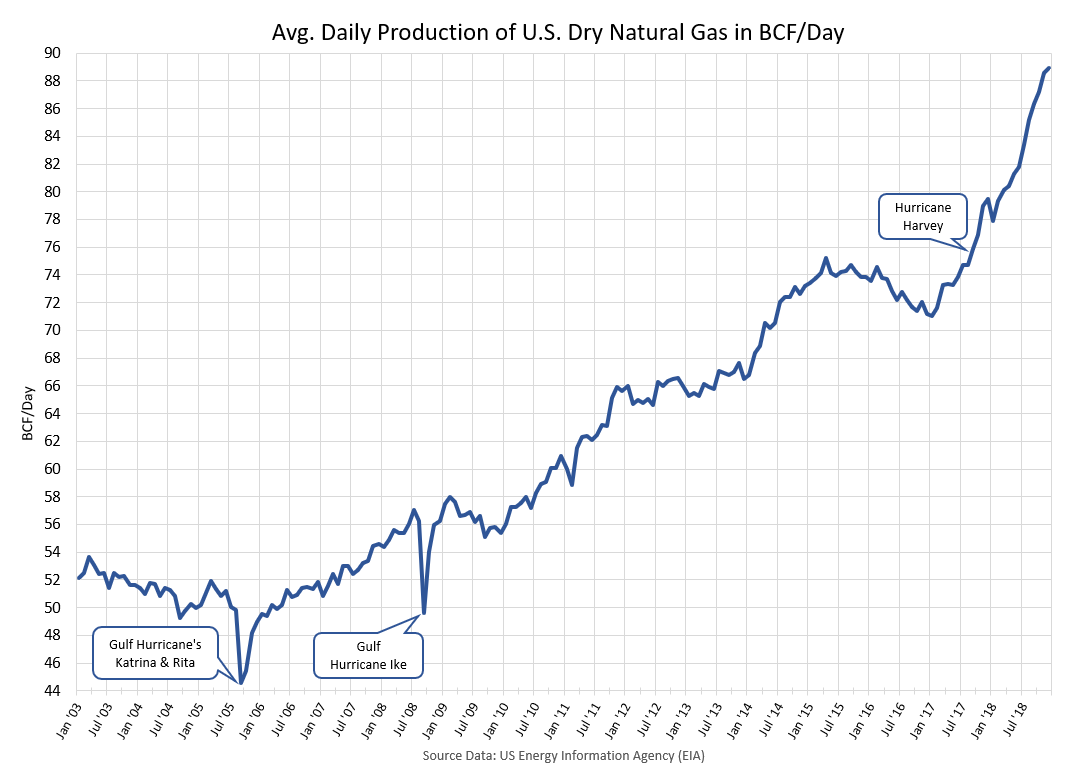 Figure 2: Avg Daily Production of US Dry Natural Gas Graph, by 5
Figure 3 shows the amounts of natural gas produced from both onshore and offshore reserves. This clearly shows that onshore production has overtaken offshore production in the last ten years.
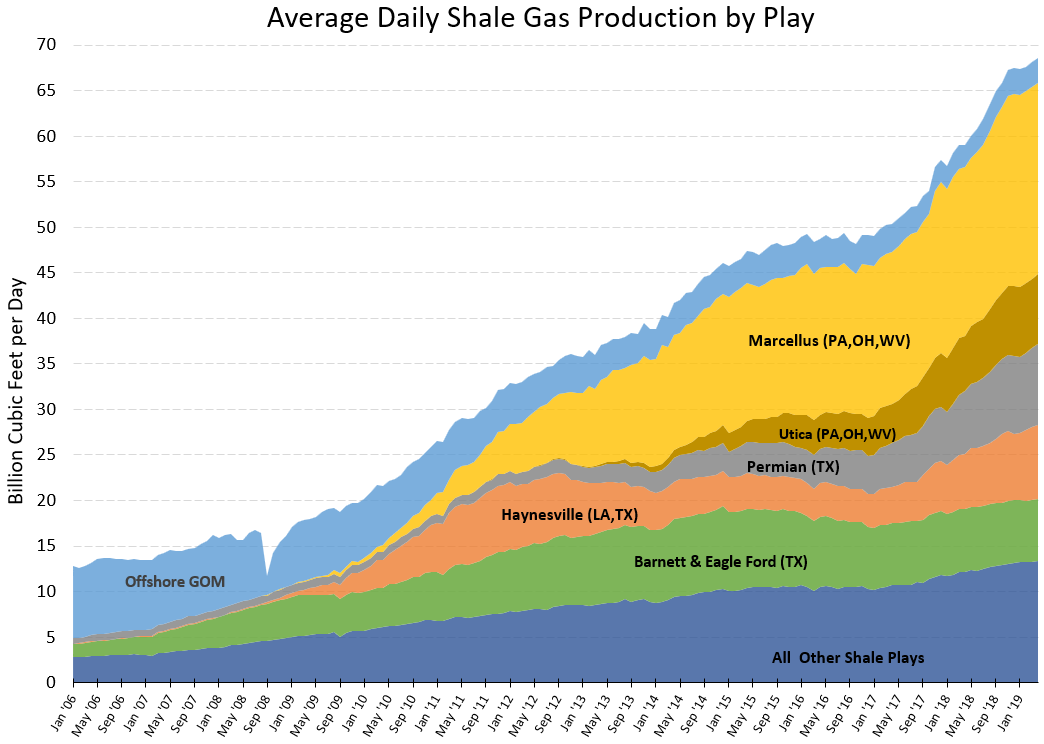 Figure 3: Avg Daily Shale Gas Production by Play Graph, by 5
In addition to evaluating the impact hurricanes have on the production of natural gas, it is also important to understand the impact these storms have on the demand for natural gas, or more specifically the demand for electricity.
Hurricane Harvey hit the Texas coast on August 25, 2017 near Corpus Christi.
Figure 4 shows total daily electricity usage for the state of Texas for the summer of 2017. The typical usage prior to Harvey’s landfall was about 1.25 million MWh per day. Two days later, on August 27th, daily usage fell by almost 30% to 900,000 MWhs per day. This amount of electricity usage equates to an average of 2 Bcf per day of gas consumption for the week of August 25th through the 30th, assuming the majority of that electricity supply came from natural gas fired power plants.
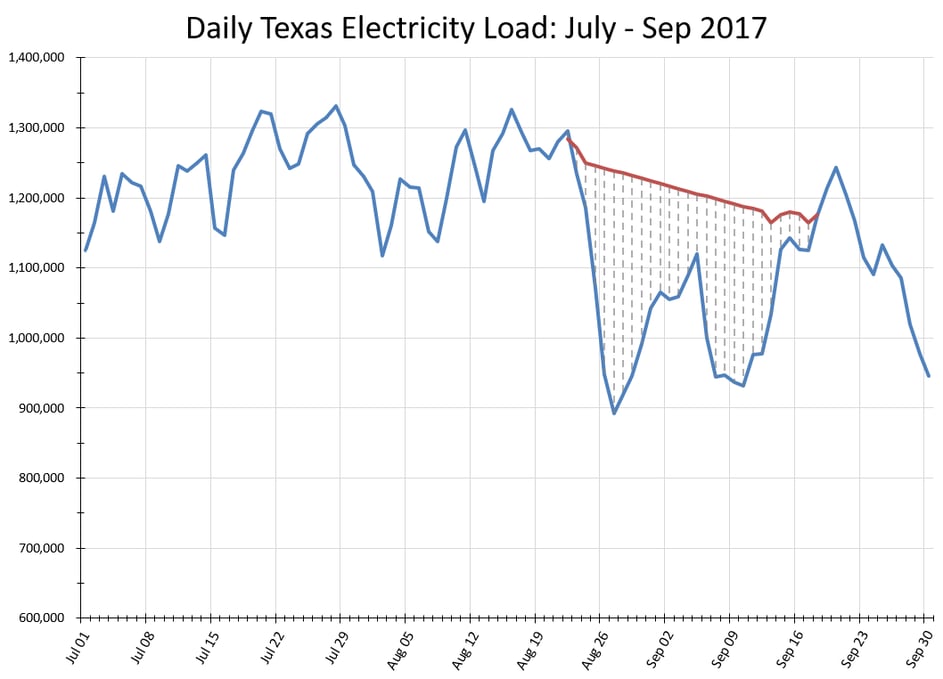 Figure 4: Daily Texas Electricity Load Graph, by 5
The shaded area in Figure 4 shows the reduction in electricity usage during the 3.5 weeks following Hurricane Harvey’s landfall. This corresponds to approximately 35 Bcf of natural gas that was not burned to produce electricity – and that is only in Texas. The remnants of Harvey, which degraded into a tropical storm, also had a negative impact on electricity usage and demand for natural gas as it moved across the country.
In today’s natural gas production environment, that total drop of natural gas demand is much larger than the drop in production from the Gulf of Mexico. Hence, large hurricanes are now becoming electricity load killers more so than production killers, and that typically equates to a downward impact (bearish) to natural gas prices instead of an increase (bullish).


