Volatility continues to be the name of the game in the energy markets for Downstate New York and New England. An example is the rollercoaster ride of international liquefied natural gas (LNG) prices that rose to record all-time highs above $90/MMBtu in September before falling back down below $30/MMBtu in November. This recent drop in LNG prices has taken some of the premium out of both power and natural gas prices for this winter, but the cooler-than-normal temperatures over the past two weeks seem to have added a bit of fear into the minds of energy traders who are concerned that this could signal a colder than average winter.
Algonquin is one of the major pipelines that carry natural gas into New England from its origination point in New Jersey. The price for this winter’s (December – March) gas delivered on Algonquin is shown in Figure 1. This chart shows that prices in late July and August were trading near $35/MMBtu, but as international LNG prices fell throughout September and October, prices for this winter’s delivery dropped down to a low of $20, before rallying back up to around $28/MMBtu during the second half of November.
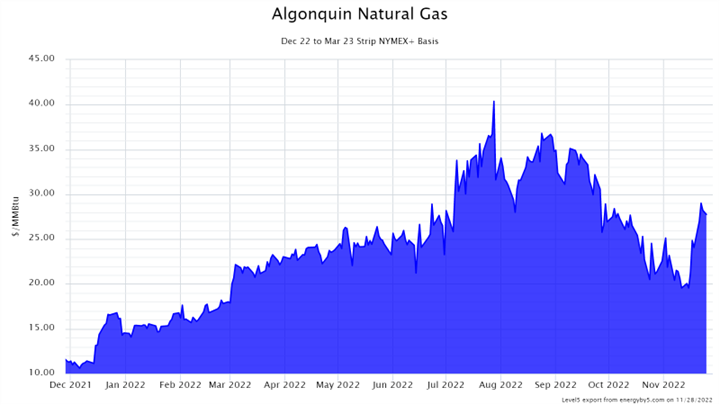 Figure 1: By 5
This fall and sudden rebound in regional natural gas prices have also affected forward power prices for this coming winter in both New England and New York. Energy prices in New York and New England are closely correlated because natural gas pipelines connect these two regions in addition to their electricity grids, which are also physically connected. Therefore, when there is a lack of natural gas supply available to New England on the coldest winter days, and the region must rely on imported gas from the LNG terminals, the market is quickly brought into equilibrium with international natural gas prices, which over the past year have been significantly more expensive than domestic gas supplies. The parallel between energy prices in New York and New England is clearly seen in Figures 2 and 3 which show wholesale forward electricity prices in Boston and New York City for January and February 2023.
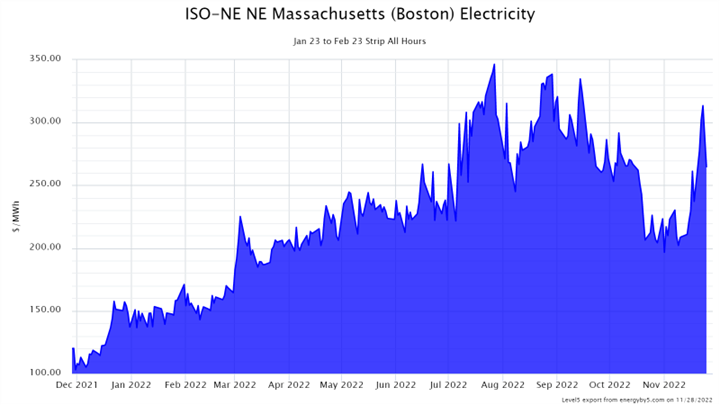
Figure 2: Jan – Feb 2023 Power Prices for Boston
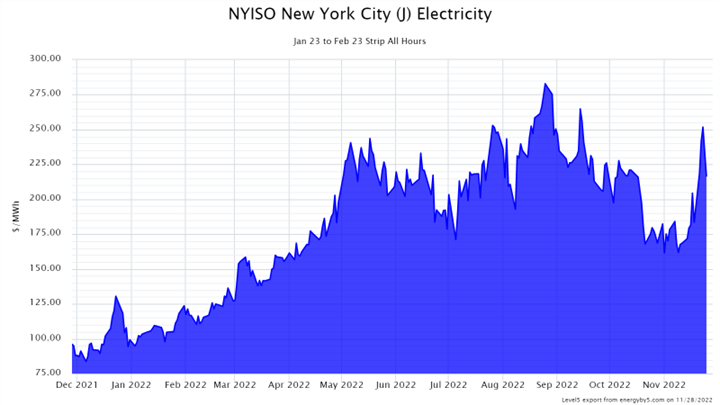
Figure 3: Jan – Feb 2023 Power Prices for New York City
This reality of New York and New England’s dependence on imported LNG prices has been the main driver in forward electricity price volatility, which is having a significant impact on retail power prices this winter. In New England, most utilities hedge on behalf of their default service customers by purchasing in short and medium-term tranches. In New York, the utilities do not typically hedge for their customers at all. This means the impact of this volatility will very likely be felt by all utility-supplied customers in both regions in the coming months.
The good news is that it is only November, and there is still time for energy traders to change their minds about the severity of the coming winter. If warmer-than-normal temperatures return to the meteorologist’s forecasts, we might see prices return to price ranges seen in early November. Figure 4 shows that as of last week, the National Oceanic and Atmospheric Administration's (NOAA’s) forecast for December was right in line with their standard, early season forecast for a La Niña year, which is cooler on the Northern and Western halves of the country and warmer in the South. In order for this winter’s price to fall in New York and New England, we will likely need to see those orange and red colors in Figure 4 expand to the Northeast before traders sell off their positions for January and February.
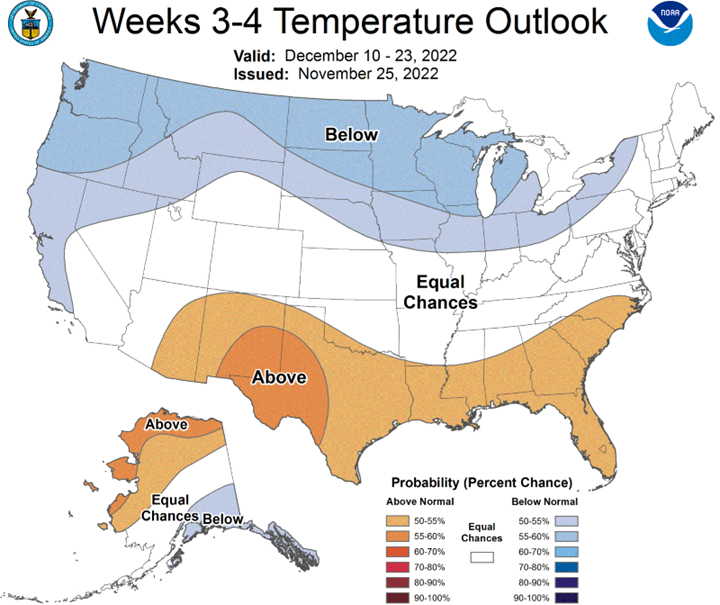
Figure 4: NOAA’s Climate Prediction Center’s forecast for December 10 - 23


