What is causing global forces to outweigh the domestic signals for natural gas prices?
If you still buy into the old trader’s tale of “buy natural gas in the fall and spring when it is cheaper” it’s likely that your energy purchasing strategies are as unlucky as your March Madness bracket. Last fall we saw one of the largest natural gas rallies in recent history as European and Asian storage levels were depleted and international LNG prices reached record highs. Now, at the beginning of spring, when natural gas withdrawals from storage are starting to dwindle and the country normally shifts to producing more natural gas than it consumes, we are again looking at another significant market rally, with April’s NYMEX contract settling at the highest price for any April delivery since 2008.
While it is true that in the spring domestic demand for natural gas decreases as the need for space heating decreases, it is often the unforeseen changes in the market that shock the system more than predictable seasonal changes. This spring is no exception and last Thursday’s events serve as a great example.
With temperatures starting to rise across the country, the amount of natural gas withdrawn from storage each week typically declines. Every Thursday, the Energy Information Agency (EIA) releases a report showing the weekly net change in the amount of natural gas in storage. Most market analysts expected that last Thursday’s storage report would show a net weekly withdrawal of about 60 billion cubic feet (Bcf) from storage. Instead, the total weekly withdrawal was 51 Bcf, which was significantly lower than expectations. On the face of it, this sounds like bearish news, meaning that this information should drive market prices down. Instead, that news was heavily trumped by news coming from Europe amid the conflict in Ukraine and the energy crisis it is creating.
Also on Thursday morning, it was reported that President Biden wanted the US to work with its international partners to make available 15 billion cubic meters (Bcm) of additional LNG to the EU in 2022, and an additional 50 Bcm (1,765 Bcf, or 4.8 Bcf/day) of additional US LNG for the EU by 2030. To put that amount of gas into perspective, the EU imports around 150 Bcm of natural gas from Russia annually. Today, the total US LNG export capacity is only about 135 Bcm. 50 Bcm is about 5% of the total current annual US production of natural gas, which is not insignificant. This bullish news obviously eclipsed the extra 9 Bcf of gas “found” in the forecast miss for the weekly storage report.
And while the US does not have much additional capacity to liquify more natural gas, the tide on regulatory approval for natural gas pipeline and LNG terminal projects seems to be turning quickly. Last month, the Federal Energy Regulatory Commission (FERC) released an update to a policy statement that, in short, would make pipeline and LNG projects more responsible for both upstream and downstream GHG emissions. On Friday, the FERC basically reversed its course and declared that those updates were not applicable to pending or filed projects and are seeking comments on the matter. This, along with a statement from the White House that the US, “commits to maintaining an enabling regulatory environment with procedures to review and expeditiously act upon applications to permit any additional export LNG capacities that would be needed to meet this emergency energy security objective.1” This statement gives the market the signal that the US government is about to open the tap on natural gas exports as quickly as possible.
Everyone knows that political statements, especially during times of war and crises, can be said for many reasons and with a variety of motivations. And just because the White House made this claim, does not mean that it will come to fruition exactly as stated. But traders still love to say “buy the rumor and sell the fact,” meaning that markets get bid up on news like this, and sell off only when the news becomes reality.
The balance of 2022 (Apr-Dec) is currently trading above $5.60/MMBtu as shown in Figure 1. This is a 60-month high, along with calendar years 2023 through 2030. And while this might be deemed as scary times in the natural gas market, the price curve is still backwardated through 2025, with 2024 through 2027 still trading below $3.75 for now but trending upward.
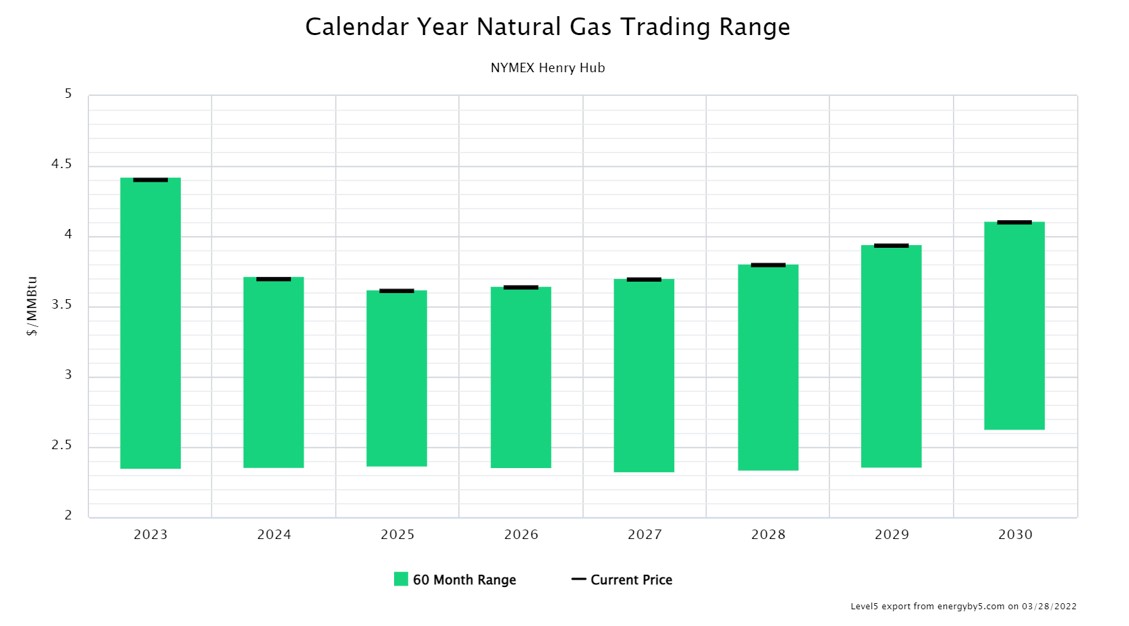
Figure 1: Calendar Year Natural Gas Trading Range from 5
We understand that it is a difficult decision to purchase a commodity when it is at its peak, but a backwardated market is not always guaranteed and generally rare in the energy markets. Clients with short-term open positions in this market are likely to be faced with some difficult purchasing decisions soon as this bull market will adversely affect energy budgets.
If clients still have open positions in some of these middle to outer years, we highly recommend you begin revising your stopping points, both for upside and downside market movements, and avoid the higher volatility in the first 18 to 24 months of the forward curve.
[1] https://www.naturalgasintel.com/biden-pledges-expedited-u-s-lng-project-oks-to-wean-europe-from-russian-gas-by-2027/


