Global natural gas markets are finally starting the rally that many producers had been anticipating in recent years. Last year, global demand for LNG dropped so precipitously that some LNG buyers elected to pay LNG liquidation terminals their contractually obligated tolling agreement payments and canceled their delivery of the actual commodity. Subsequently, last summer spot prices for the Japan/Korea Marker (JKM, the Asian LNG version of the Henry Hub natural gas trading hub in the US) traded below $3 per MMBtu. On July 28 of this year, the future contract for September LNG delivery was trading around $14.50 per MMBtu. Figure 1 shows that the JKM price for LNG has increased three-fold over the last year.
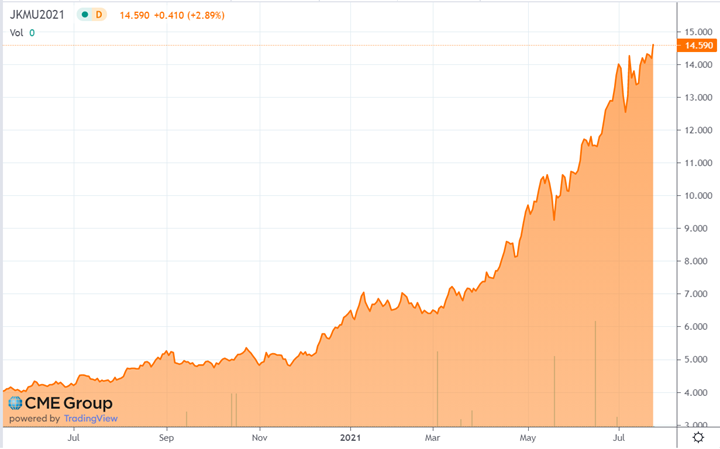
Figure 1: Japan/Korea Marker Price for LNG from cmegroup.com
Similar price increases have occurred with European spot natural gas prices, which are also correlated with the JKM LNG index. Figure 2 shows where spot prices for natural gas have settled in Asia (red line) and Europe (blue line) in relation to the US (green line). Strong overseas demand is one of the main reasons why the US LNG export terminals have been running at full capacity for most of this year. The large price differential between US Henry Hub and the other major foreign energy markets will likely keep LNG terminals running at full capacity for the foreseeable future.
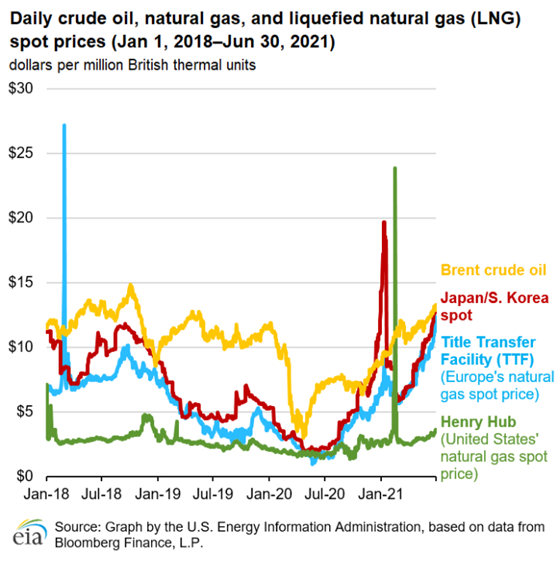
Figure 2: Daily Crude Oil, Natural Gas and LNG Spot Prices from eia.gov
Domestically, the sustained heat in the West throughout June and early July, followed by the continuing warmth in the South during the second half of July, has increased the amounts of natural gas consumed by power generators to keep up with the nation’s cooling demand. This higher demand, coupled with steady increases in pipeline exports to Mexico from Texas, has started to shift the supply-demand balance. This is disclosed weekly when the EIA releases its storage inventory report.
Last summer, the concern in the natural gas market was that the nation was running out of storage capacity. The red line in Figure 3 shows that one year ago, storage levels were above the 5-year historical range, which made many energy analysts confident that there was plenty of supply relative to demand. Now, the situation is reversed. Instead of storage levels being above the 5-year range, the US will likely enter the winter heating season with storage levels that will be closer to the 5-year low than to the 5-year average.
Usually, the summer injection season is the time of the year when producers are replacing the natural gas that was consumed during the winter heating season. However, the robust foreign demand for natural gas has incentivized producers to send that gas overseas where it is much more profitable as opposed to placing it into domestic storage. This relatively abrupt change in the balance of supply and demand is one of the factors that is putting bullish pressure on near-term natural gas prices.
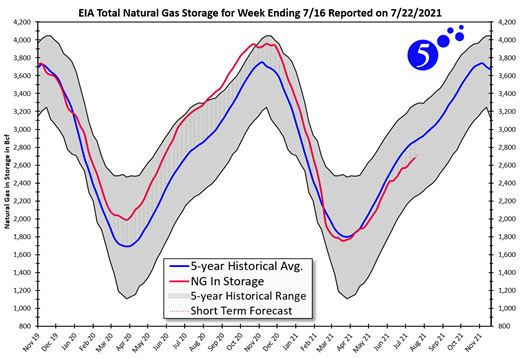
Figure 3: EIA Total Natural Gas for Week Ending 7/16 from 5
Figure 4 shows the sustained rally in the domestic natural gas prices over the last several months. At the beginning of the year, gas for the calendar year 2022 was trading at $2.51 per MMBtu. On July 26, that same 12-month strip traded at $3.45 per MMBtu, an increase of 37% in seven months. A similar rally has occurred in spot prices. On June 1, the August gas contract traded at $3.10 per MMBtu, on July 28, it settled at $4.10 per MMBtu.
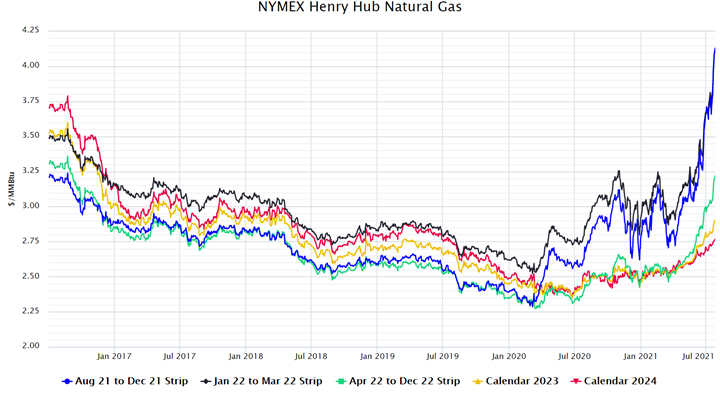
Figure 4: NYMEX Henry Hub Natural Gas from 5
Longer-term prices are a little more muted, with Q2 to Q4 of 2022 up 50¢, calendar year 2023 up about 25¢, and 2024 up about 14¢. The vast majority of the volatility is contained in the first 18 months of the forward curve. While this provides a buying opportunity for 2023 and beyond, it also might be part of the problem. With such strong backwardation in the market, producers are incentivized to increase production immediately. Given the financial struggles oil and gas producers have seen over the past year, many are requiring longer-term certainty in the form of higher futures prices, allowing them to lock in increased margin prior to spending significant amounts of capital to increase production. Many in the industry are applauding the shale players for their capital discipline and expect that it will be sustained well into 2022.
This makes the recommendation for all buyers with unhedged natural gas positions beyond this winter to seriously consider closing some of those open positions. The conflict created as producers continue to exercise capital discipline while in a strongly backwardated market is more likely to cause the forward market prices to rise as we move through time.


