Over the last few months, these updates have focused on the steady run-up in natural gas prices, and the correlation between US natural gas prices and gas prices in other parts of the world, specifically the price of LNG in Asia and Europe. Each month it may seem like a broken record (pun intended, get it?) as we report that wholesale natural gas prices have hit new, record highs. This month, domestic natural gas soared to 10+ year highs, which pushed short-term forward prices to levels we have not seen since early 2008. The last time prices were this high, this country was in the midst of “the Great Recession” and “hydraulic fracturing” was just emerging as a technology that sent a very volatile gas market into a decade of slowly declining prices.
Since the beginning of April, the average price of the next 12-months of NYMEX Henry Hub delivered natural gas has increased from $5.72 per MMBtu on April 1st, to a high of $7.73 on April 18th, an increase of over $2.00 per MMBtu (Figure 1) over 11 trading sessions. This was on top of the $1.00 per MMBtu increase from March 1st to April 1st. Not only was this rally the strongest the natural gas market has seen over the last two decades for the prompt month, but it also extended across the entire forward curve, a phenomenon we have not seen since the mid-2000s.
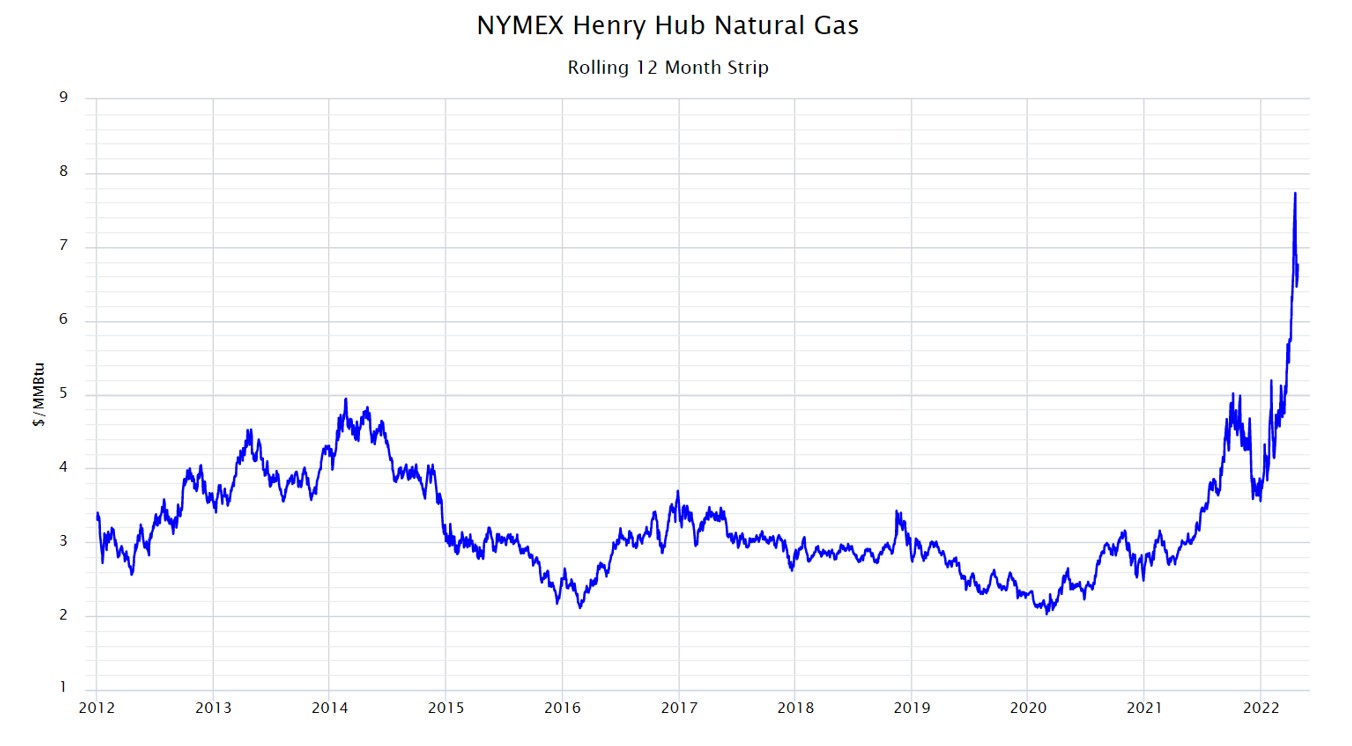
Figure 1: NYMEX Henry Hub Natural Gas Rolling 12 Month Strip from 5
Recently, when the front half of the forward curve would move dramatically in one direction, the back portion of the forward curve, beyond 18 to 24 months, would typically move in the opposite direction. This market rally over the last couple of months seems to be a very different beast. This is a market that is not driven by natural phenomena (weather-driven demand or supply interruptions), or simple supply-side economics, but instead points to a seismic shift in the future demand for domestic natural gas to supply multiple Western European nations that want to distance themselves from the world’s largest exporter of natural gas - Russia.
And while natural gas prices did not recover as quickly as goods such as lumber and steel in the wake of the pandemic, this latest rally is stronger and more dramatic than almost all other traded commodities. Figure 2 shows the movement in the same 12-month rolling NYMEX Henry Hub price, where each blue dot represents the daily change in gas prices over the last 10 years. Low price volatility can be observed where the data points are clustered together, while periods of high price volatility can be seen where those data points are more scattered. This chart shows a moderate amount of volatility from 2012 through 2014, where on any given day, most price movements were limited to less than 10¢/MMBtu. From 2017 through 2020, the dots are closer together, showing a period of reduced volatility with minimal daily price variation. Over the last 18 months, this pattern has completely changed. Beginning in the fall of 2021 through 2022, one can see significantly more variation around the mean, which has drastically increased the standard deviation of daily price movements. For example, 2012’s standard deviation was around 7¢, 2016 through 2020 were all below 5¢ per day, 2021 was closer to 10¢, and 2022, so far, is close to 20¢, with April alone approaching 30¢ per day.
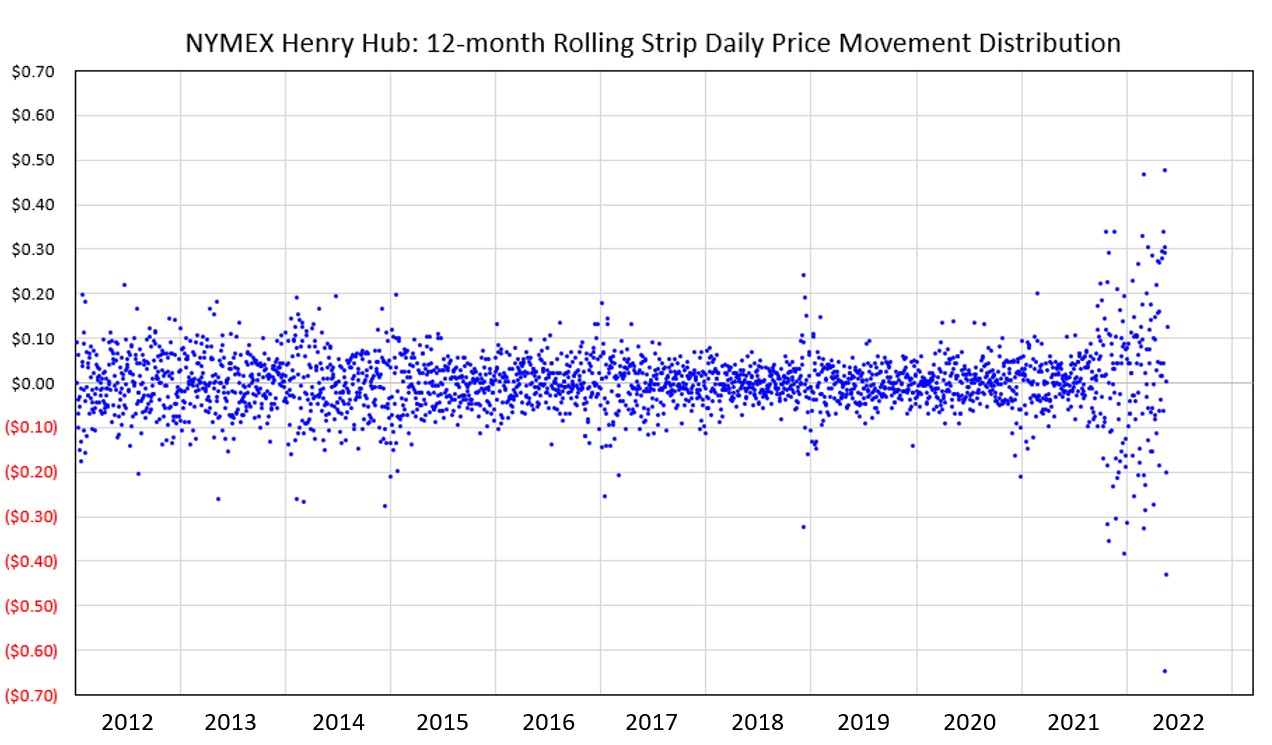
Figure 2: NYMEX Henry Hub: 12-Month Rolling Strip Daily Price Movement Distribution from 5
This volatility does a few things that are not very favorable to end-use buyers. First, it increases the premiums suppliers must place on offers to keep them open for multiple hours during a trading session or force them to retract offers already sent out on days when the market rallies.
Secondly, volatility entices commodity traders to enter a market and increase its volatility. A stale and tranquil market does not give day-traders much room for profits. But a highly volatile market allows traders room to buy and sell the commodity intraday. This influx of both buyers and sellers enables technical traders to move markets in directions or magnitudes that perplex more fundamentally focused analysts and traders.
Additionally, this kind of market volatility increases forward market premiums. If the purpose of a forward market is to protect buyers and sellers of a commodity from the volatility of the spot or short-term market, more volatility increases the cost of options and other financial derivatives, including swaps, the financial instrument behind the forward markets.
This is just another strong indicator that this does not appear to be the same natural gas market we have grown accustomed to for the past 10 years. This commodity was once a very domestic commodity that was rarely affected by anything outside of North America. However, this new reality of higher prices with greater volatility may be with us for a while as natural gas becomes more globalized and the world tries to transition itself away from dirtier fossil fuels like coal and crude oil.


