What are the Drivers of Natural Gas Production and Pricing?
The dramatic changes in demand for many commodities over the past 24 months have wreaked havoc on supply chains across the world - energy markets are no exception. When demand for oil and gasoline tanked in the spring of 2020, oil prices fell to record lows, with near-term delivery prices even going negative. Natural gas prices did not fare much better, with spot prices during the summer and fall of 2020 setting new 25-year record lows. Producers of both oil and natural gas quickly reacted to those price signals, and production of both commodities began to drop as capital expenditures quickly ceased.
Since mid-2021, both oil and natural gas prices started to recover. Furthermore, inventory levels of both commodities have been slowly increasing to more normal levels, driven by both decreased production and demand growth as economies of the world reopened and recovered. Figure 1 shows how the spot price of crude oil has changed from May 2020 to Jan 2022.
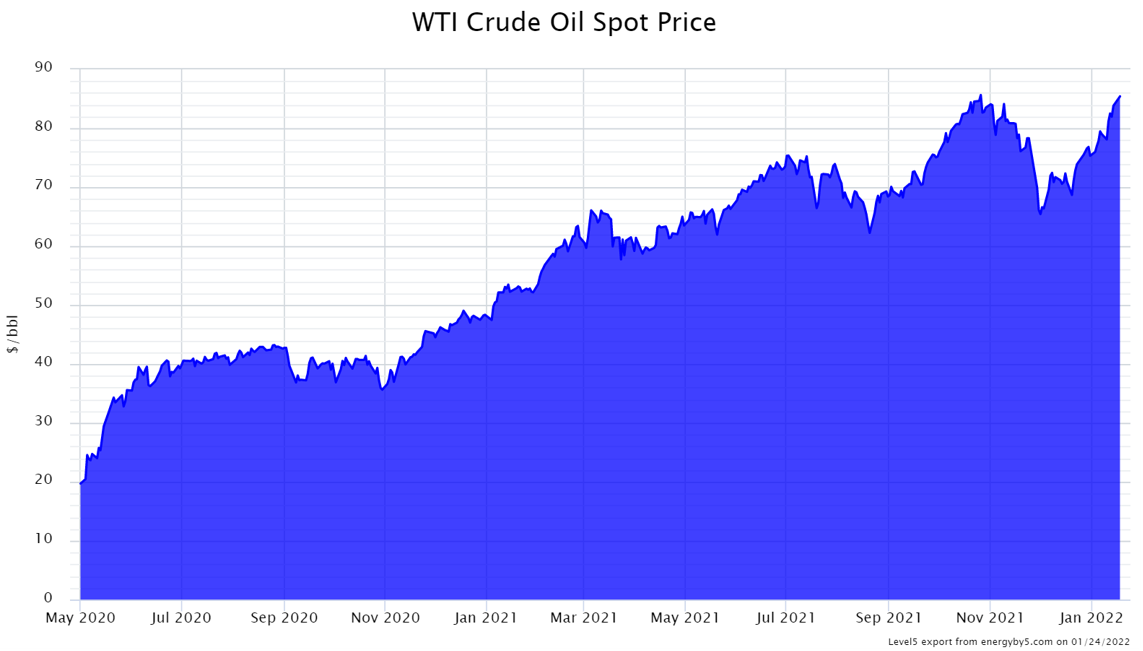
Figure 1: WTI Crude Oil Spot Price from 5
When crude prices fell in March and April of 2020, it was expected that crude production would decrease in the largest oil patch in the US, the Permian Basin in West Texas. What might not have been as apparent to those outside the industry is that gas production from the Permian Basin, which is the second-largest natural gas-producing region (see Figure 2), also fell. While natural gas in the Permian Basin is rarely targeted by drillers, it is the byproduct of crude oil production and is commonly referred to as “associated gas” since it is usually extracted along with the crude oil that is recovered from the wells. As expected, the amount of natural gas produced from the Permian Basin declined from 12.2 Bcf/day in March 2020 to 10.5 Bcf/day in May 2020. Since May 2020, production of natural gas from the Permian has slowly increased with the freezing temperatures of Winter Storm Uri in February 2021 as the only month where production slowed.
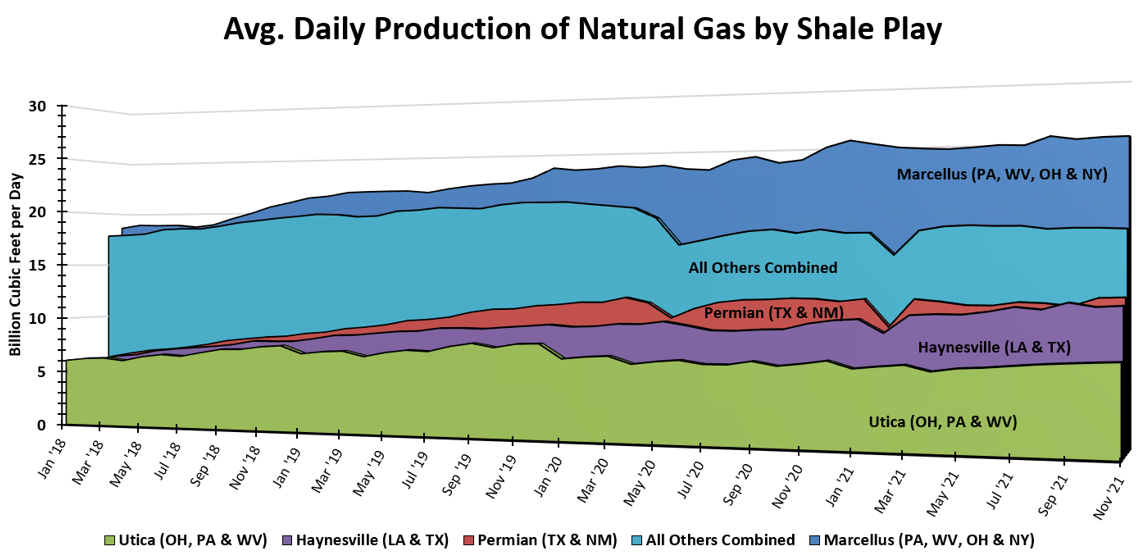
Figure 2: Average Daily Production of Natural Gas by Shale Play from 5
As crude prices recover back above $80 per barrel, the amount of associated natural gas from the Permian has slowly increased to more than 14 Bcf/day, according to market data company IHS Markit.
The Haynesville reserves in East Texas and Louisiana, shown in Figure 3, are now quickly becoming the new darling of the natural gas shale market. Unlike the Permian, Eagle Ford, and Anadarko reserves in and around Texas, the Haynesville is predominantly a natural gas-producing region that contributes almost as much daily natural gas as the Permian Basin, but less than 1% of the daily amount of crude oil.
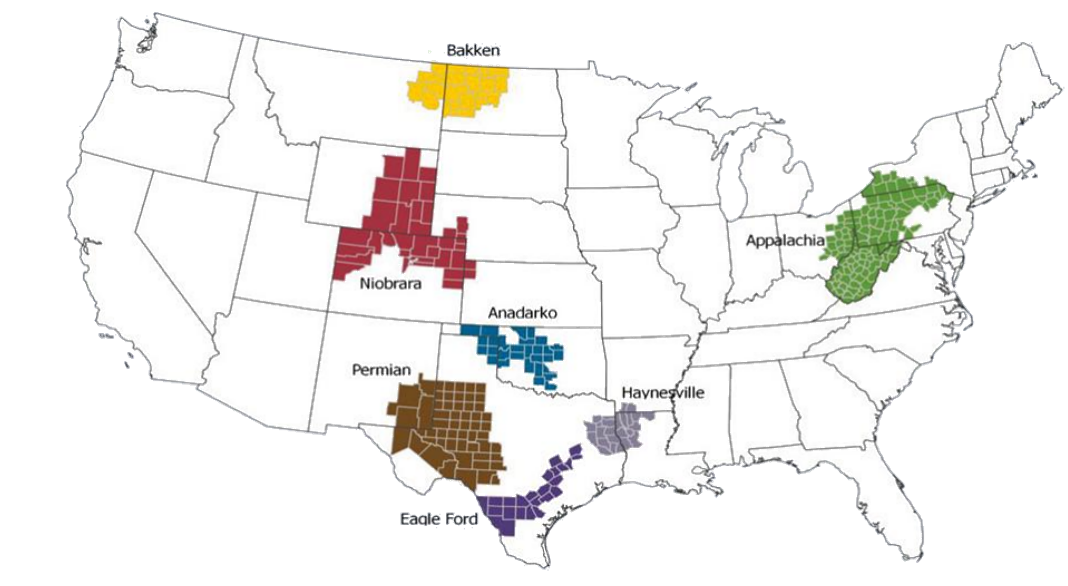
Figure 3: Map of Natural Gas Reserves in the US from eia.gov
Haynesville’s natural gas production has increased from less than 10 Bcf/day in early 2020 to about 12 Bcf/day currently, the largest increase of any region, in both percentage increase and daily volume. The major difference between the Haynesville and the Marcellus and Utica shale regions in Appalachia is Haynesville’s proximity to the vast majority of LNG export terminals along the Gulf Coast, which has created the single largest increase in demand for natural gas in the last few years.
With demand for both pipeline and liquified natural gas expanding quickly due to many fundamental and geopolitical factors, it seems Texas and the surrounding states are helping to meet the rapidly increasing demand for US natural gas, with those two regions making up 84% of the year-over-year increase in domestic natural gas production from December 2020 to December 2021. If this trend continues, it could have a large impact on domestic basis market prices for natural gas between Louisiana’s Henry Hub and many other previously depressed trading hubs in the Northeast, along with overall supply and demand impacts on domestic inventory levels as we continue to export more natural gas from Texas and Louisiana.
In Other News:
Escalating tensions between the US, Europe, Russia, and Ukraine also seem to be centered on the flow of natural gas supplies. As shown in Figure 4, the pipeline system in Ukraine currently transports most of Europe’s Russian-provided natural gas. The Nord Stream 2 pipeline, an expansion of the Nord Stream system laid along the floor of the Baltic Sea, is a $10 billion pipeline system that delivers gas from Russia to Germany. Some see the Nord Stream pipeline system as a destabilizing agent in the region because widening tensions in Ukraine will have less of an effect on the amount of natural gas flowing to the rest of Europe.
The complexity of the situation cannot be explained in this article, nor can the outcome be easily forecasted, but to conclude that energy is again at the center of a major geopolitical conflict is both easy and predictable. We will continue to keep you informed as the situation unfolds.
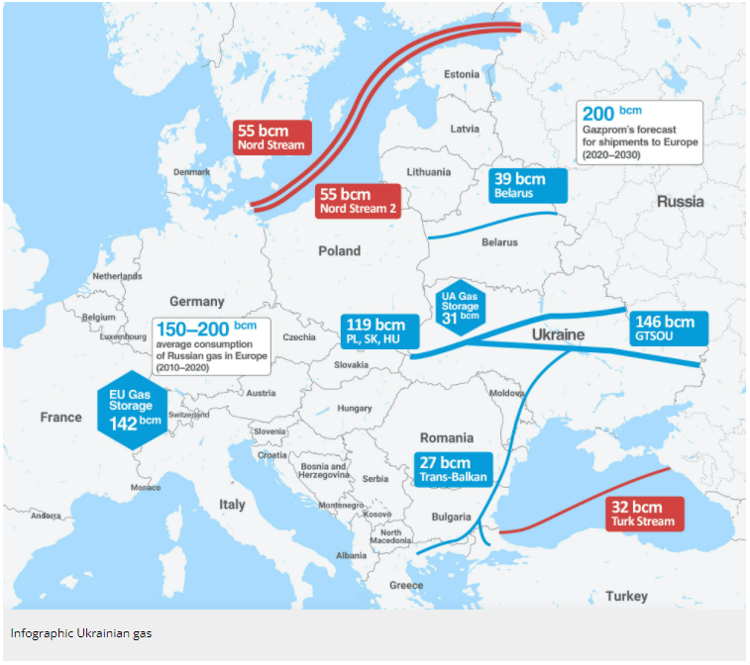
Figure 4: Pipeline System in Europe from euractiv.com


