Given the massive drop in oil and natural gas prices last year, it is no surprise that producers reacted by dramatically reducing rig counts and the amount of gas supplied to the market. This decrease in supply was not only rational but also welcomed as it stabilized prices and storage levels. This past week, the Energy Information Agency (EIA) released their graph of historical natural gas rig counts. This chart, in Figure 1 below, shows the sharp decrease in active natural gas drilling rigs in the nation’s three largest gas-producing regions. The modest increase in total rig counts over the past six months shows that producers are unwillingness to spend significant capital to increase production, given today’s market prices.
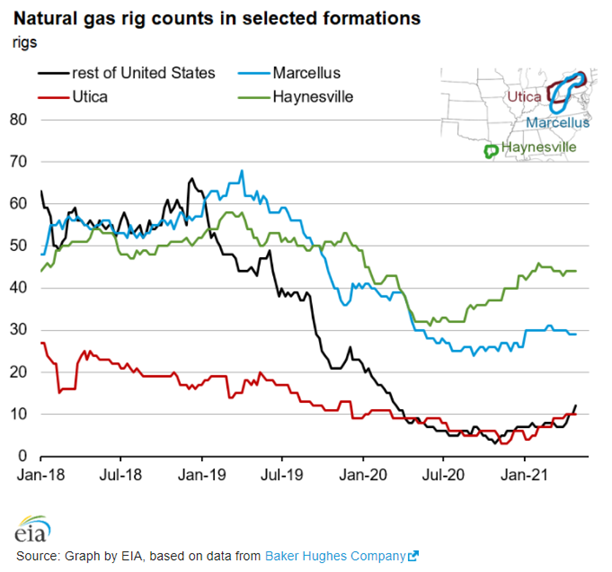
Figure 1: Natural Gas Rig Counts in Selected Formations from eia.gov
The overall trend for short-term gas futures has been moving upward, despite the fact that there has been significant price volatility in prompt month and for the balance of 2021, over the past year. The price volatility and bullish nature of this market can be seen in Figure 2, which shows how prices for calendar year 2021 have traded over the last 18 months. Market prices for 2021 found firm resistance levels around $3.10 per MMBtu, with all months between July 2021 and March 2022 above $3.00 per MMBtu.
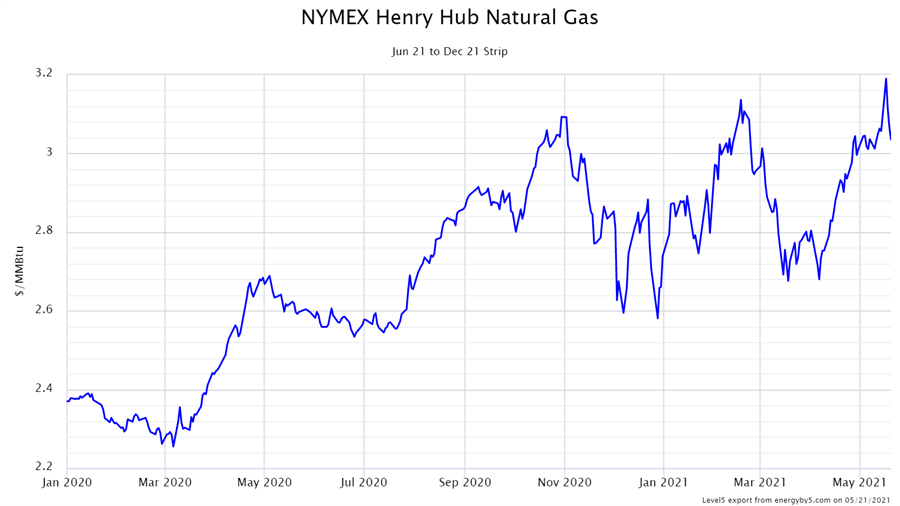
Figure 2: NYMEX Henry Hub Natural Gas June 2021 - Dec. 2021 from 5
As shown in Figure 3, beyond March 2022, forward prices drop significantly, creating a steep backwardation in the market. Prices are so backwardated, that all non-winter months for years 2023 to 2025 are trading below $2.50 per MMBtu, while all winter months are still trading below $2.95, a significant discount to how futures are trading over the next 10 months.
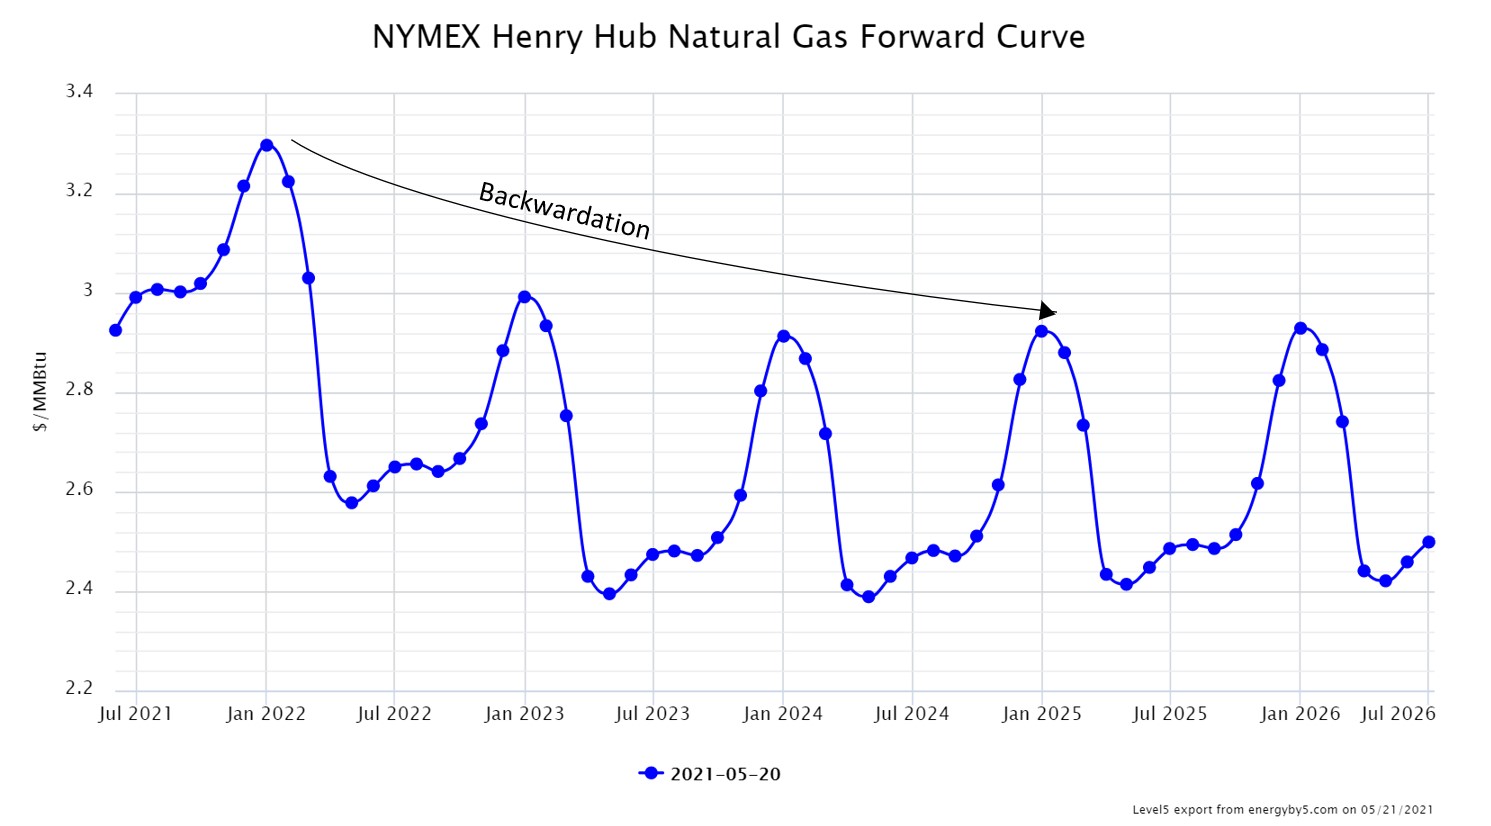
Figure 3: NYMEX Henry Hub Natural Gas Forward Curve from 5
From a trader’s point of view, the market seems bullish both technically and fundamentally. From a technical point of view, long-term trends are still bullish with prices trending upward across the entire forward curve, with the balance of 2021 setting both higher highs and higher lows in its trading cycles. Fundamentally, with production relatively flat, demand rebounding, and storage levels decreasing compared to both last year and the 5-year average, the supply-demand balance seems to be tightening with a reduction in both supplies and inventories. All of these indicators suggest a market which is bullish in nature.
Given the relative discounted nature of forward market prices for March 2022 and beyond, it is prudent to take advantage of this backwardated market. Clients with open gas positions should consider making futures purchases and capitalize on favorable market conditions while they exist.


