
What a difference three months make in the constantly changing landscape of the natural gas market in the US. Last September, the December delivery contract for NYMEX’s Henry Hub, was trading at approximately $9.50/MMBtu, while natural gas prices in Europe were trading near $90/MMBtu. On November 28, the December contract settled for the last time at a final price of $6.65/MMBtu, a drop of almost $3.00 from the August high, while major European trading hubs are now near $30/MMBtu.
There were several factors that moved future prices for this winter’s gas delivery down from its late-summer highs. However, many of those bearish influences have started to change and reverse direction.
First, inventory levels of US natural gas in storage grew through the months of September through November at a pace that was significantly higher than expected. In late August, the market consensus was that the US would have about 3,400 Bcf of natural gas placed into underground storage facilities. That belief was dramatically changed when more than 100 Bcf of gas went into storage for six of the next seven weeks. The 1,004 Bcf of injections between weeks ending September 2 and November 11 was almost twice as much as in 2020, and the largest of the last decade.
Those injections came to a dramatic reversal on the Wednesday before Thanksgiving when the EIA reported the first withdrawal of the season of 80 Bcf, with an even stronger withdrawal expected for Thursday, December 1. Figure 1 shows that the gap between gas in storage and the five-year average was reduced from 10.5% in late August to 0.4% on November 11. Last week’s 80 Bcf withdrawal was enough to open that gap to 3.3%.
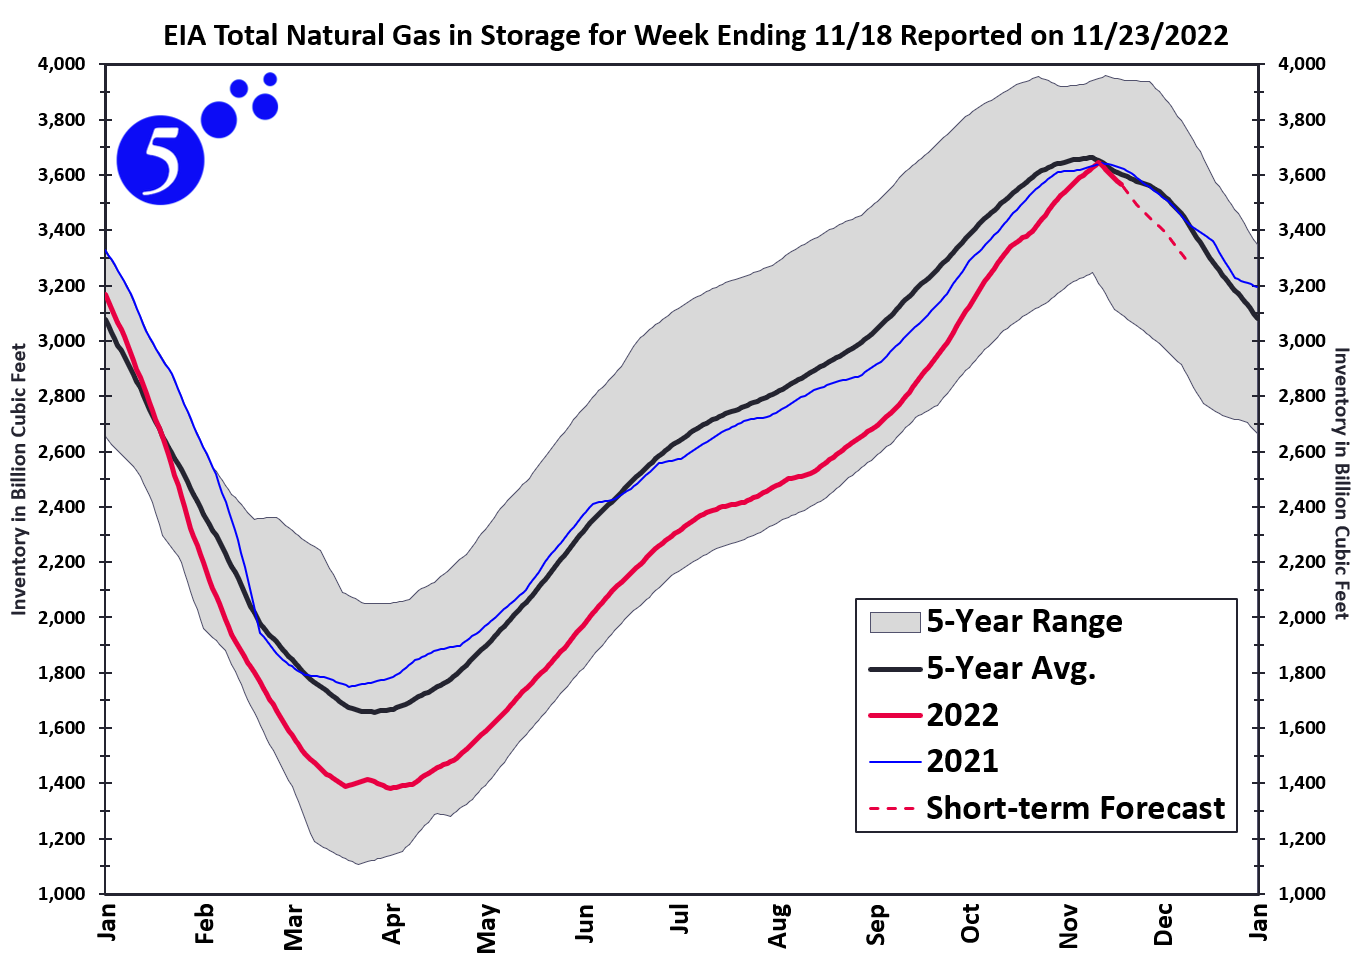
Figure 1: US Natural Gas Storage Inventory Levels
Mild temperatures in September and October helped to build up storage levels and put downward pressure on natural gas prices along with the delayed re-start of the Freeport LNG terminal. This LNG export terminal south of Houston went offline in June after an explosion in one of its LNG transportation pipes shut down operations. Original estimates that the plant would return to service in November were overly optimistic, and every day the plant stayed offline essentially left 2 Bcf of gas stranded in the US market. The plant is now reporting they are expecting to come back online partially during the month of December and will resume full export capacity by the end of the winter.
The potential railroad strike in the fall also had energy markets a little worried. In September, natural gas prices spiked by more than $1/MMBtu, and then fell the next day, when it was reported that the eminent strike was averted. Now that the strike is back in the news, the potential for coal shipments (which are domestically moved by rail) to cease is worrisome to gas traders. This has caused prices to increase. And even though coal usage across the US is down, the high price of natural gas this year increased demand for coal compared to 2021. Since railroads carry on average about 8,500 shipping cars of coal per day, even a short strike would increase coal prices, which would continue to put upward pressure on gas prices.
The weather has been a mixed bag lately as cold temperatures in the last two weeks of November were enough of a reason for the bulls to mount a rally. We are likely to see our third La Niña winter, where temperatures in the northern half of the US are colder than average. Figure 2 shows that while two sequential La Niña years are very likely, a third strong year of La Niña is rare. NOAA is also forecasting a high probability of returning to an El Niño weather pattern by spring or summer, which usually brings more rain in the south and milder winters.
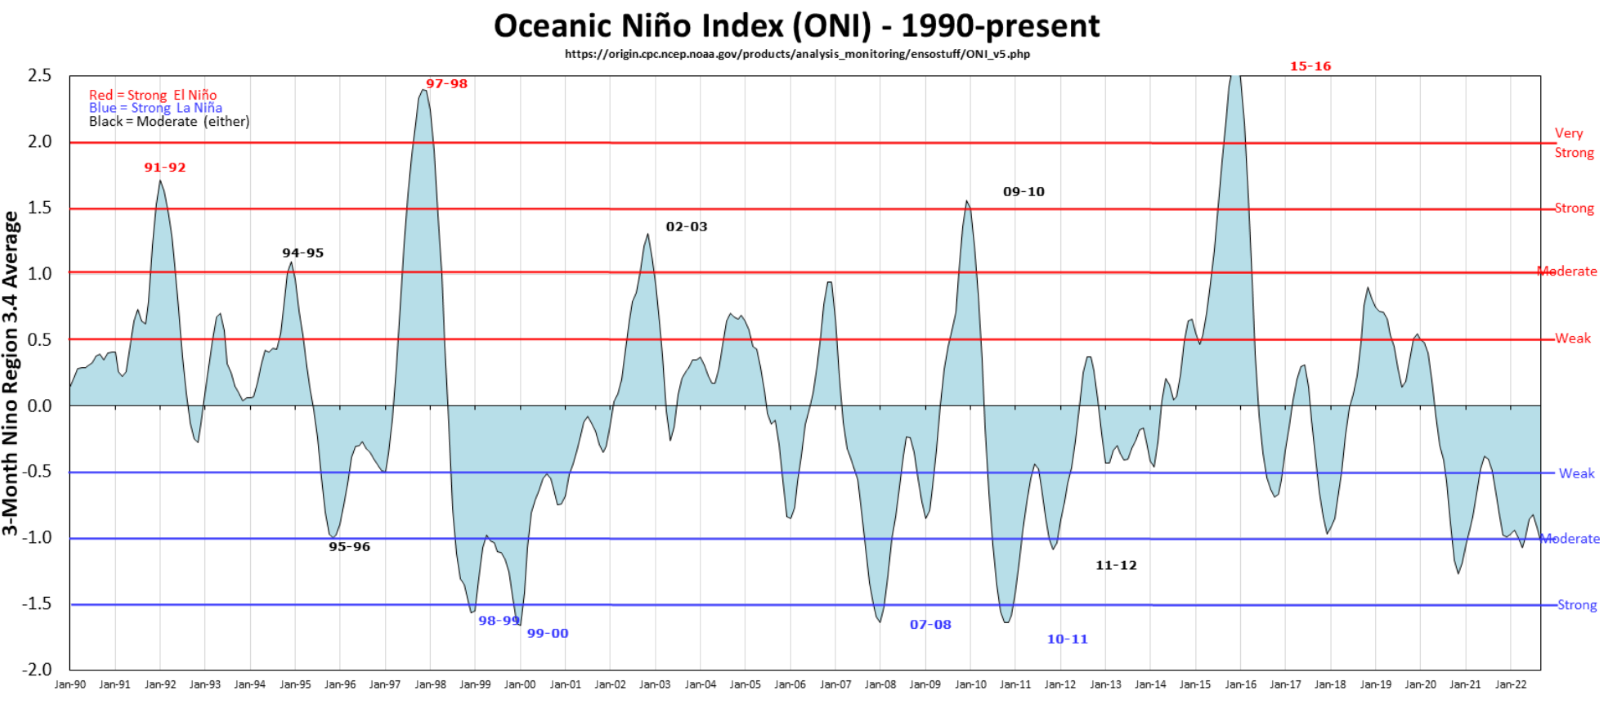
Figure 2: Oceanic Niño Index courtesy of Golden Gate Weather Services
Uncertainties around the weather have created more volatility in the natural gas market over the past month. This has increased the amount of daily price volatility for calendar year 2023 (blue line in Figure 3) and increased prices. This chart also shows that prices for calendar years 2024 to 2028 are also up compared to where they were at the beginning of October.
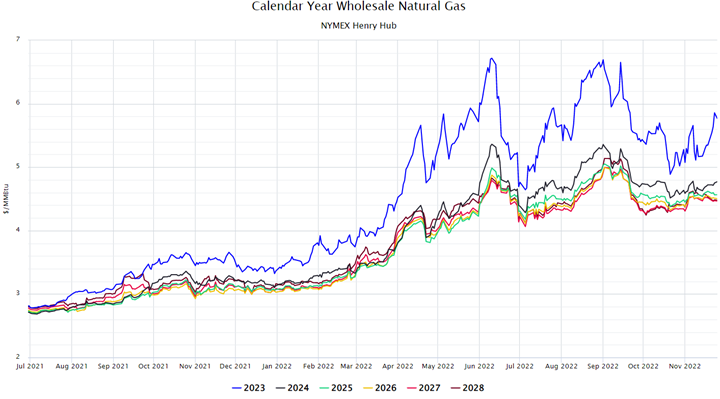
Figure 3: By 5


