
The current electric load in ERCOT is exceeding what was initially forecast. The current system demand (green line), today’s forecast (blue line), and yesterday’s forecast (red line) are shown in Figure 1. There is a high risk that today’s system load will set the Coincident Peak (CP) for August.
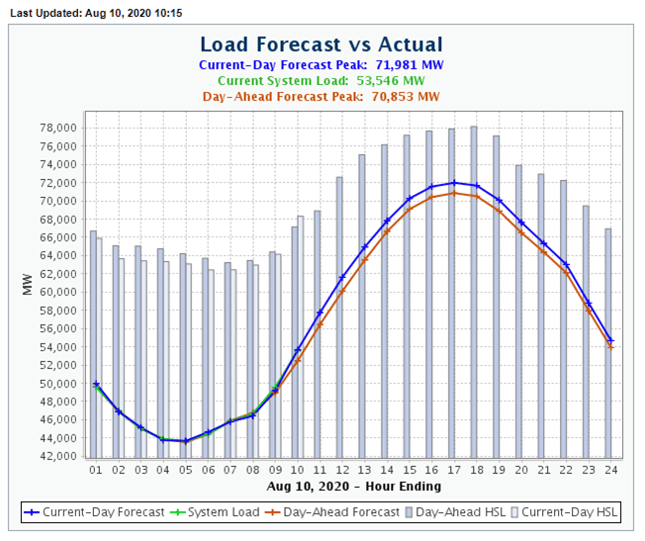
Figure 1: ERCOT Load Forecast vs. Actual, from ercot.com
And while the 4CP risk for today is high, that risk will also remain in place for the balance of the week. High temperatures in North Texas will be at or above 100° through Friday. So far, it seems like this will be the hottest week of August.
As is often the case, the wild card may be afternoon thunderstorm activity on the coast. In Houston, there is a 40% chance of afternoon thunderstorms today and Friday. In a week like this, the best way to manage the 4CP risk in real-time is to watch the weather and doppler radar in the afternoon. If pop-up rain showers move into the Houston area (and to a lesser extent Corpus Christi), it will reduce the risk of a 4CP event. Rain in big coastal cities will drive down temperatures and the amount of air-conditioning load throughout ERCOT. If rain showers are not in the afternoon forecast, clients should be prepared to proactively curtail electricity usage between 3:00-6:00 PM each day. Reducing peak demand today will lower Transmission costs next year.
Strong and steady winds should mitigate the risk of high spot (real-time index) prices this week. This will also reduce the probability of demand response events. The “Bermuda High” pressure system remains off to the east, which should create strong on-shore wind flows. This high pressure is expected to be centered over the East Coast by mid-week as shown in Figure 2. This system should generate the wind speeds necessary for wind-generating assets to keep up with electricity demand this week. Real-time wind speed indicators into Texas from the Gulf of Mexico are shown in Figure 3.
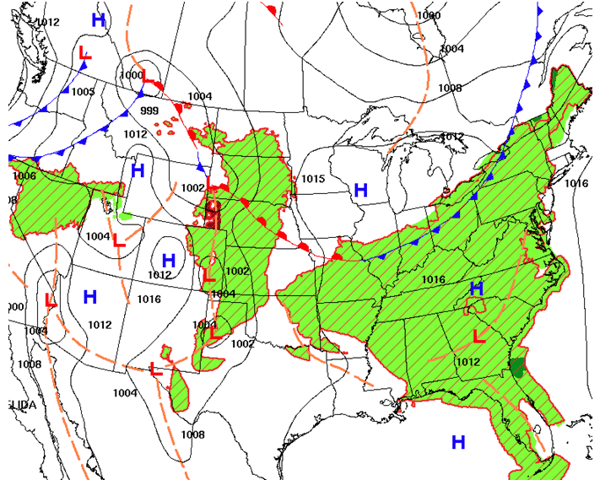
Figure 2: Location of High Pressure Systems for August 12th, from noaa.gov
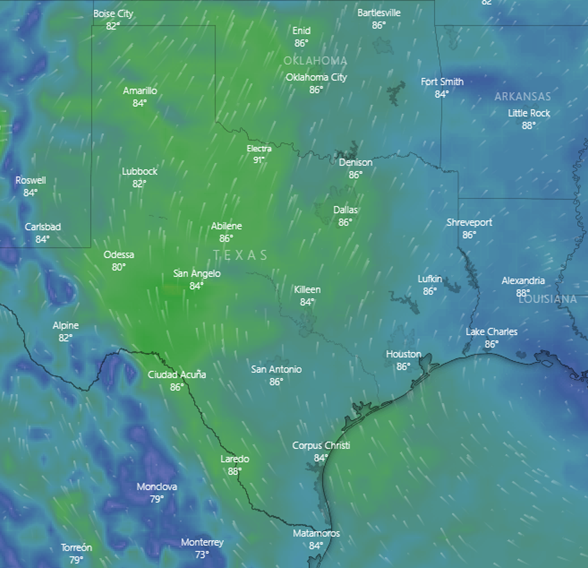
Figure 3: Real-Time Wind Pattern, from windy.com
5 will provide updates throughout the course of the week as conditions change.
Reach out to your energy advisor or contact us for more details.


