
Market Info & Updates

Many states throughout the country, especially along the East Coast, have aggressive plans to construct solar and wind farms to produce electricity. States such as New York and Maryland have established mandates that will require up to 50% of the electricity in those states to come from renewable sources over the next 10 to 15 years. And while these goals are admirable, the facts are that strong, sustained winds and lots of sunshine are not abundant in the Northeast. Additionally, there are plenty of opposition groups that, may ultimately, block these initiatives which will require new transmission lines to distribute this electricity.
The chart below shows the installed capacity of renewable power and the percent of electricity these projects generate in the states looking to develop offshore wind and solar projects.
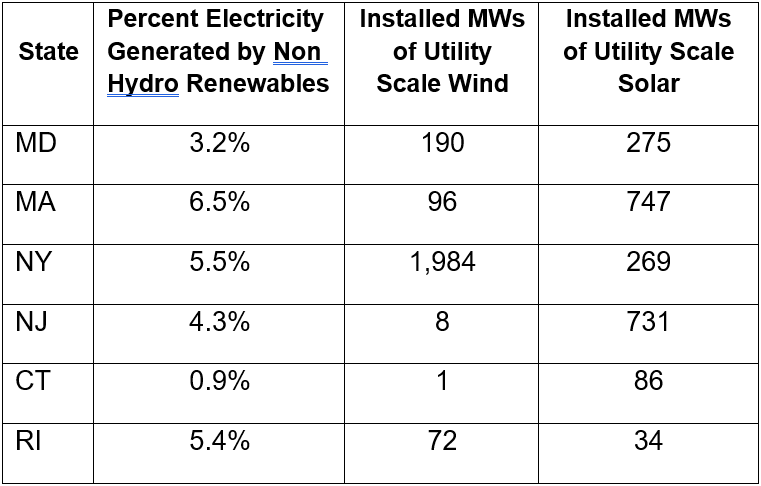 Figure 1: Electricity Generated in the Northeast, by 5
As this chart demonstrates, only a small fraction of electricity generated in the Northeast comes from renewable sources. The location of renewable generation in the United States is a regulatory paradox. States with the least aggressive renewable incentives generate the most renewable power. As the chart below shows, Kansas, Iowa, Oklahoma and Texas generate 52% of the wind power in the US.
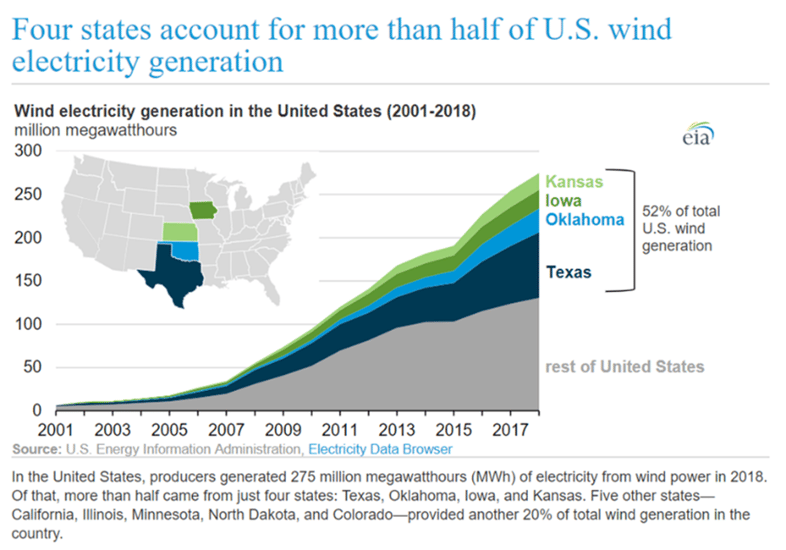 Figure 2: Wind Electricity Generation in the Unites States (2001-2018), by eia.gov
Available land and strong winds are an important part of the answer. You will not find thousands of acres of wind-swept farmland along the East Coast. But even so, we think that differences in state regulatory policy contributed to the success of renewable development in states such as Texas.
Northeastern politicians and regulators should seek the advice of their counterparts in Texas to help them think through how to get these large offshore wind projects built. Massive wind farms in West Texas generated almost 19% of the electricity in Texas in 2018, and constitute over 23% of the current installed generating capacity in the state. On some days, wind powers more than 50% of Texas’ electricity requirements. The chart below shows the amount of solar and wind generating capacity that is planned in ERCOT. Based on this data, Texas should continue to lead the nation in renewable generation for some time to come.
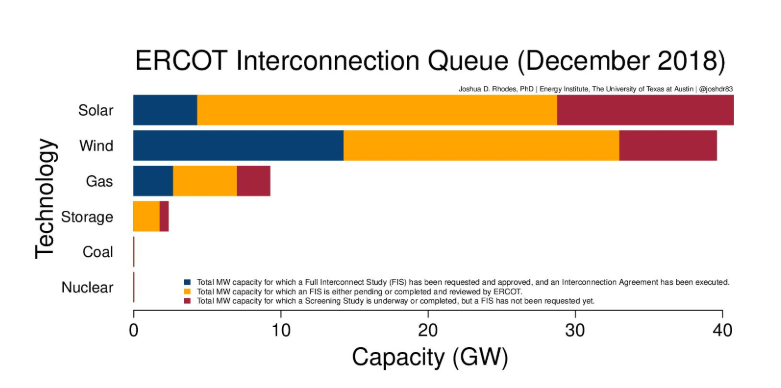 Figure 3: ERCOT Interconnection Queue, by Greentech Media
Excellent wind resources and an abundance of land is a large part of the Texas success story. However, the ease of permitting, the state’s willingness to invest $7 billion in new transmission, and the ability to get these transmission lines built are equally important factors. These transmission lines allow Texas to move low cost renewable power from rural parts of Texas to the load centers in Houston and Dallas. Power plants and transmission lines are not the only things that are easily permitted in Texas.
Infrastructure projects, on the whole, seem to pop up overnight in Texas as state regulations are much more favorable toward development. This is not the case in most parts of the Northeast. In general, any kind of infrastructure and development projects are met with extensive opposition. A good example of this is the Williams natural gas pipeline. This proposed pipeline was designed to address the critical shortfall of natural gas in the metropolitan New York City area through the construction of a 26-inch pipeline that would run under New York Harbor (see map below).
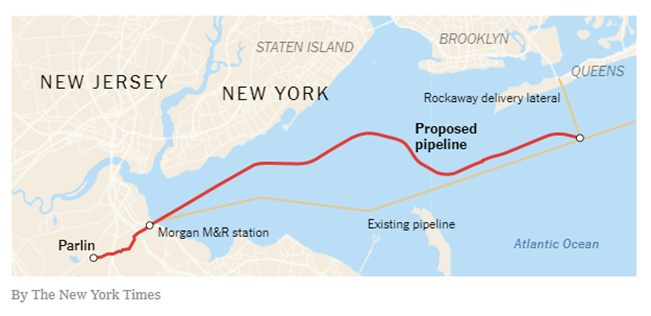 Figure 4: Proposed Pipeline Construction, by The New York Times
Despite the need for more natural gas in and around New York City, this pipeline project has been blocked by groups that argue that it would, among other things, promote the sale of fracked natural gas (New York State banned fracking in 2014), threaten human health (since it would be placed under the seabed), and harm marine life. If New York and the other Northeastern states are going to permit anything close to 20 GWs of offshore wind, the politicians and regulators must find a way to overcome the inevitable opposition to necessary infrastructure improvement (e.g., transmission lines) from fisherman, boaters, beach front property owners and other interest groups. The cost and permitting challenges faced by offshore wind provides a perfect litmus test of a state’s commitment to a carbon-free generation fleet.

 Nov. 17, 2026
What El Niño and LNG costs could mean for winter energy prices
 Nov. 17, 2026
California Direct Access: Why the Lowest Electricity Price May Not Be the Best Deal
 Nov. 9, 2026
New SBTi Rules Could Change What You Pay For RECs
 Oct. 9, 2026
Winter 2026-27 Outlook for Gas and Power Markets: 5 Things to Know from our Live With 5
 Sept. 10, 2026
Buy or Wait? Why Waiting is Also an Energy Buying Strategy
 Sept. 10, 2026
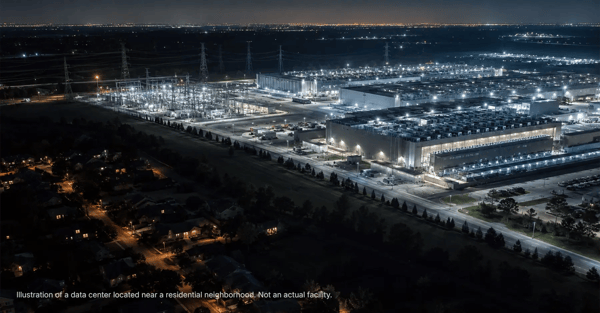
New Rules, New Developments: An Update on Data Center Regulation
 July 31, 2026
5 Things to Know From Our Webinar "How Data Center Growth is Reshaping Power Markets"
 June 29, 2026
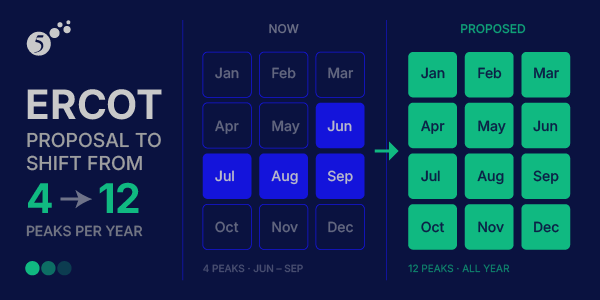
ERCOT Market 3X-ing Coincident Peak Method, Moving from 4CP to 12CP
 June 29, 2026
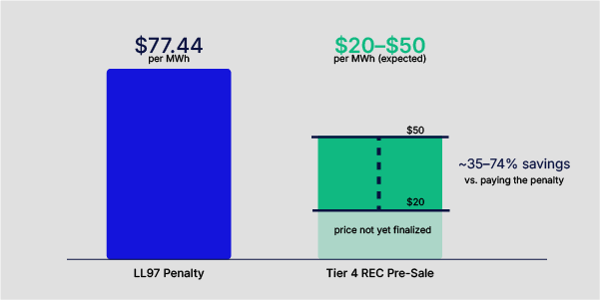
NYSERDA to hold first pre-sale of Vintage Tier 4 RECs in July
 May 20, 2026
5 Key Takeaways from Our "Navigating Energy Markets and the Middle East Conflict" Webinar
 April 27, 2026
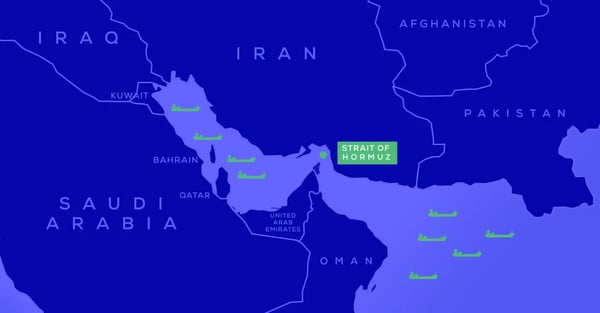
What the Middle East Conflict Means for Energy Markets
 April 14, 2026
Coincidental Peak Alerts