At the end of last month, the news was buzzing about the newly discovered Omicron variant. On the last day of trading for the December NYMEX contract, the December price jumped up almost 50¢ to close at $5.447, settling well below the previous month’s closing of $6.202, which was the highest closing NYMEX price since December 2008.
Since that last day in November, this market has corrected significantly. By December 17, the January contract was trading near $3.70, a drop of about $1.80 in just two weeks and most of that movement occurred between November 29 and December 6.
Why the strong January sell-off since the beginning of December? The short answer is the weather, or the lack thereof, for those expecting normal December temperatures. The significantly warmer than normal start to the winter in North America took much of the winter risk premium out of the market. This is why January now trading at the cheapest price it has seen since late June 2021.
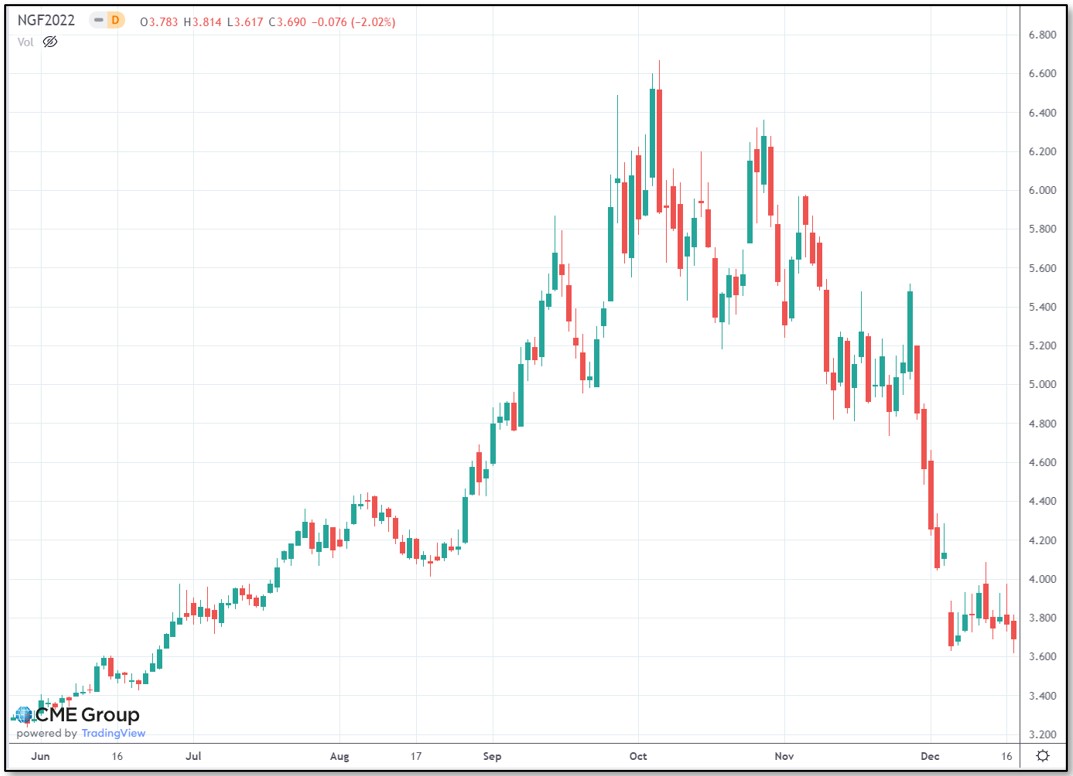
Figure 1: January NYMEX Henry Hub Contract with Daily Settlement Bars from cmegroup.com
As shown in Figure 2, the warmer temperatures to start the month of December are expected to continue into the later parts of the month as well and natural gas traders have taken notice.
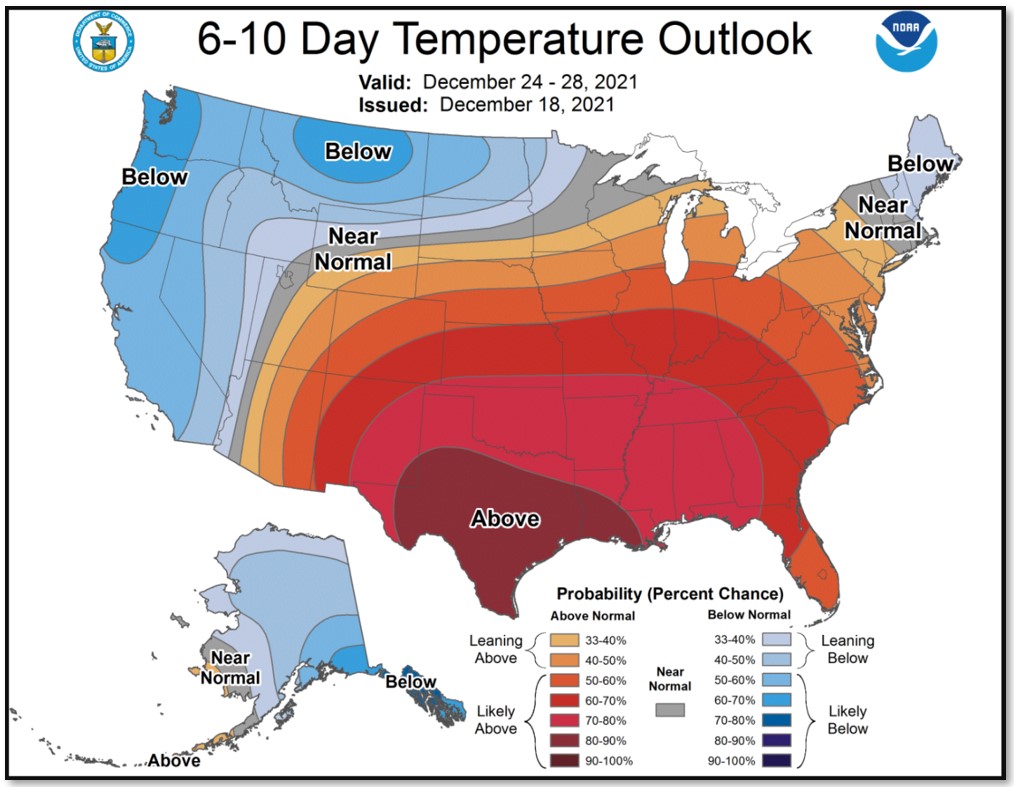
Figure 2: 6-10 Day Temperature Outlook from NOAA.com
On the other hand (and other side of both the Atlantic and Pacific Oceans), Liquefied Natural Gas (LNG) prices have risen to record highs again, with prices at the Japan/Korean Market (JKM) and the Title Transfer Facility (TTF) natural gas trading hub in Europe both trading as high as $44 per MMBtu last week. This means that even with US natural gas prices falling during the first week of December, LNG prices continue to apply bullish pressure on the market. As warmer temperatures throughout North America remain, the NYMEX Henry Hub prices are still struggling to pass through the current support levels and drop below $3.70.
There are now two likely scenarios for the domestic natural gas market in the coming weeks.
Scenario 1: Continuation of warmer-than-normal weather in North America
A continuation of the current warmer weather pattern will likely continue to put downward pressure on Q1 2022 prices, even though we have already seen significant premiums leave Q1. In fact, January 2022 is now about 30¢ cheaper than January 2023, which is trading right near $4.00. It is more likely that continued warmth will just push down Q2 and Q3 slightly, but not significantly. What could be significant is the potential for this weather to increase prices beyond Q1 of 2023 as capital seeks a better return from the forward curve. This would reduce the economic incentive to increase production while increasing the incentive to export more domestic natural gas to international LNG buyers.
Scenario 2: Return to normal, or cooler-than-normal, weather in North America
Normal or cooler-than-normal weather will likely cause an increase in Q1 2022 prices, with the rest of the 2022 curve rising as well (see Figure 3). This weather pattern could possibly move prices up to the levels from late November, which could be as much as $0.75 to $1.00 per MMBtu higher than they are today. There would likely be minimal impact on prices beyond Q3 2023.
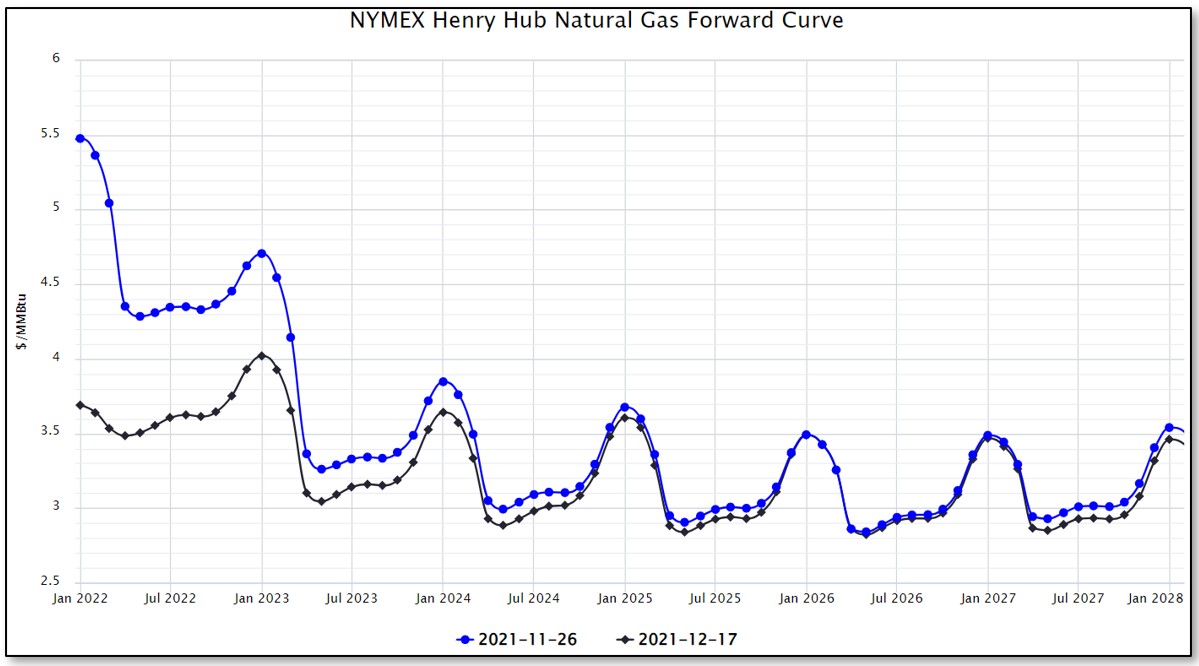
Figure 3: NYMEX Henry Hub Natural Gas Forward Curve from 5
As shown in Figure 4, the Winter of 2020/2021 started in a very similar way, with November being one of the warmest on record, and December also being very warm in the Midwest and Northeast. However, last year was also a La Niña winter and as shown in Figure 5, colder winter weather did not arrive until mid-February.
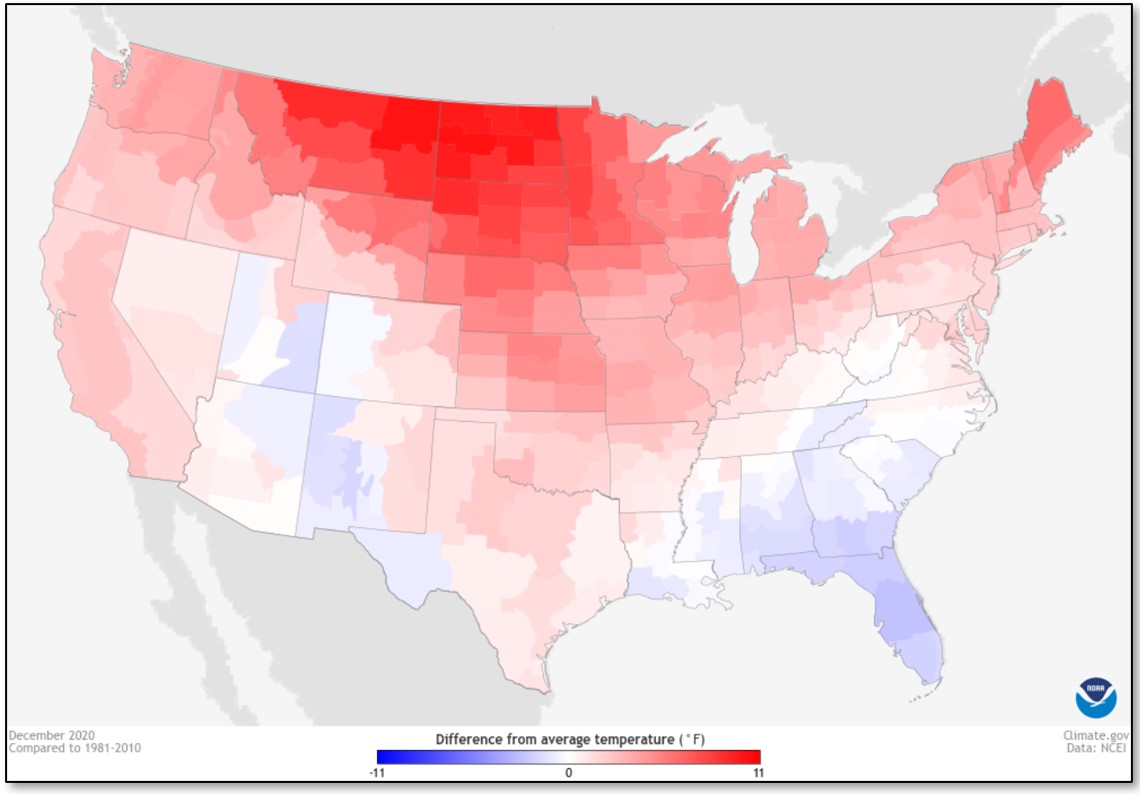
Figure 4: Difference from Average Temperature from Winter 2020/2021 from Noaa
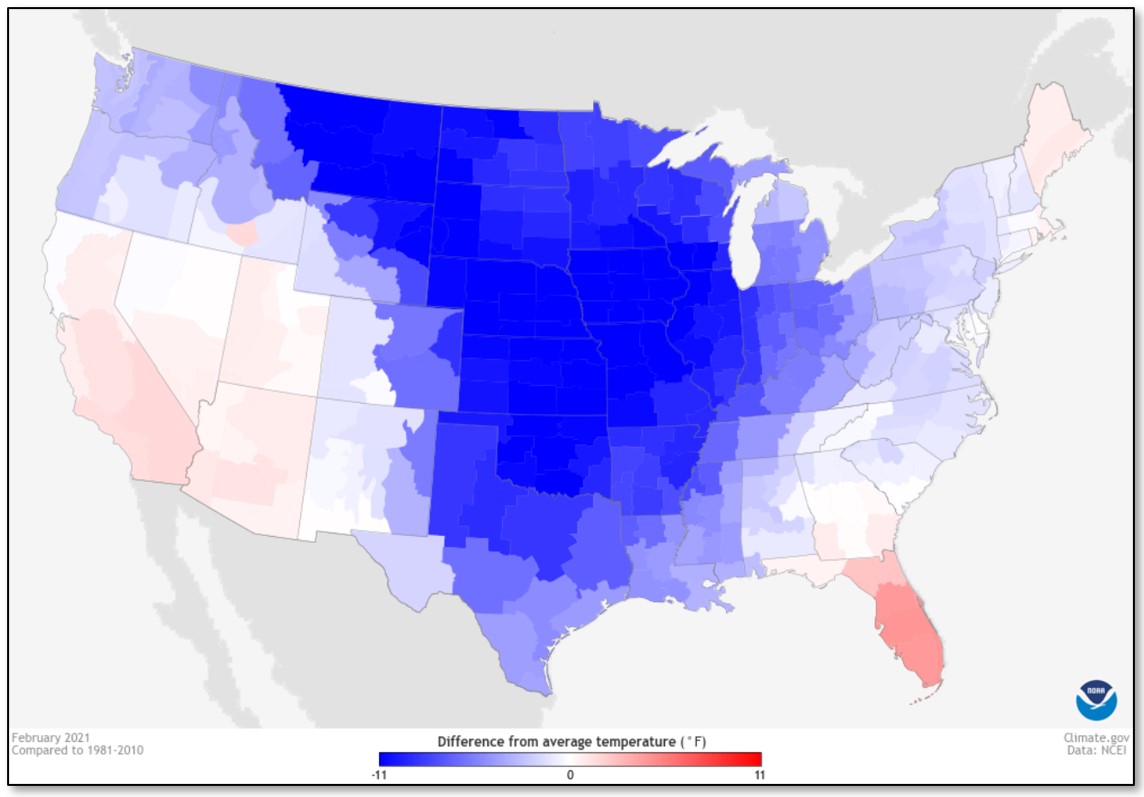
Figure 5: La Niña Difference from Average Temperature from February 2021 from NOAA
Any month with a significant increase in natural gas consumption is likely to erase all the bearish movement the market experienced in December. Traders are again waiting to see just how bad the winter weather becomes and how far behind this past spring’s starting point for natural gas storage levels will we be starting come April 2022.


