Natural Gas Update for May 2022
This past month, the US natural gas market continued the recent trend that was established in mid-February. Strong bullish tendencies set new highs and blew past previous resistance levels (ceilings or limits to the upside) while also setting new support levels for any possible retracement in the future. Figure 1 shows how the June contract settled with daily candlestick bars. And while the curve seems to have given up its exponential shape from early April, it now appears to maintain a linear upward trend. The previous two market retracements during this sustained rally both took place directly after touching the psychological resistance levels of $8.00 in mid-April, and again at $9.00 in early May, otherwise, the market has been on a consistent upward trend.
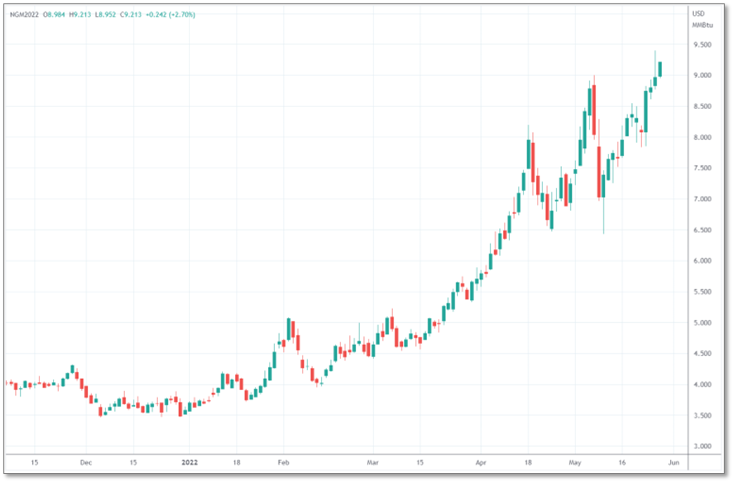
Figure 1: NYMEX Henry Hub’s June 2022 Contract with Daily Bars from cmegroup.com
The bullish trends have not been limited to the prompt month; rather prices as far out as March 2023 have also been impacted. Figure 2 shows the forward curve in the first week of each month in 2022. Note the more than 2X increase in the price of natural gas for January 2023 since the beginning of the year. Prices for the winter of 2022/2023 have increased in by about $5 per MMBtu, from around $4.00 to $9.00. And while the winter of 2023/2024 has only increased about $2.00 per MMBtu, the price for all months beyond March 2024 has only increased by $1.40. This has produced a highly backwardated natural gas market with decent purchasing opportunities.
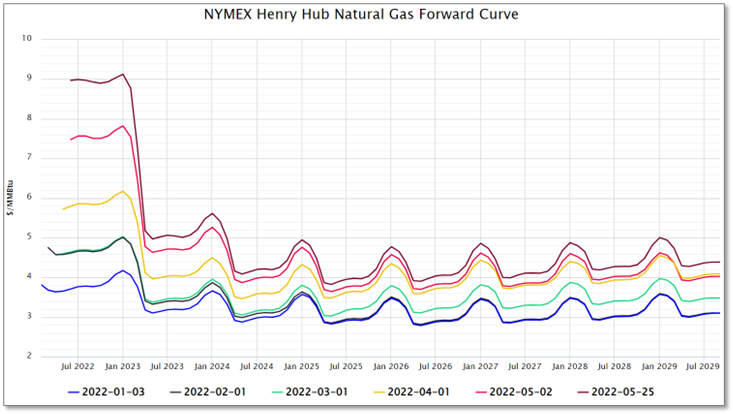
Figure 2: NYMEX Henry Hub Natural Gas Forward Curve from 5
With the relationships between many European countries and Russia continuing to deteriorate, many of those countries are looking for new energy trading partners. This means that future international demand for US domestic natural gas supply could increase significantly over the next 2 to 5 years. And while that demand exists now, it will likely take 2 to 5 years to develop additional LNG export capacity given the long development and construction cycles of these projects.
Just this past week, Venture Global LNG announced the completion of their financing requirements to move forward with phase 1 of their Plaquemines LNG terminal south of New Orleans. This initial phase will be a $13.2 billion investment capable of exporting about 1.7 Bcf per day. This news, while not unexpected, was revealing in the fact that it is the first LNG project in the US to reach financial closure since August 2019. It is also the world’s largest financed project that has closed in 2022. And while construction of the project started in 2021, prior to financing closing, the projected operation date is not until 2024.
As future demand from this and other possible LNG projects grows, it is the near-term prices of natural gas that are seeing the most volatility. This is due to multiple reasons and those reasons do not seem to match the magnitude of escalation. Instead, it appears that the balance of 2022 and Q1 of 2023 has been caught up in a rapidly escalating market that is likely driven by technical trading, trends, and investment money running after one of the hottest commodities left in the market. Does that mean that this market is destined for another correction, or that it has the potential to turn bearish? Perhaps, but this market might not fall as much or as quickly as many are hoping.
The one consistent in this market over the last month has been its resiliency and its steady bullish trajectory. Short-term fundamentals are assisting with this trend because of the following factors:
-
Warmer weather than average for most of May
-
Continued warmth in the mid-term forecasts
-
Higher than average temperatures forecasted by the National Oceanic and Atmospheric Administration (NOAA) this summer (see Figure 3)
-
Decreased probability of gas to coal switching this summer due to high coal prices
-
Sluggish increase in natural gas production, despite higher short-term market prices
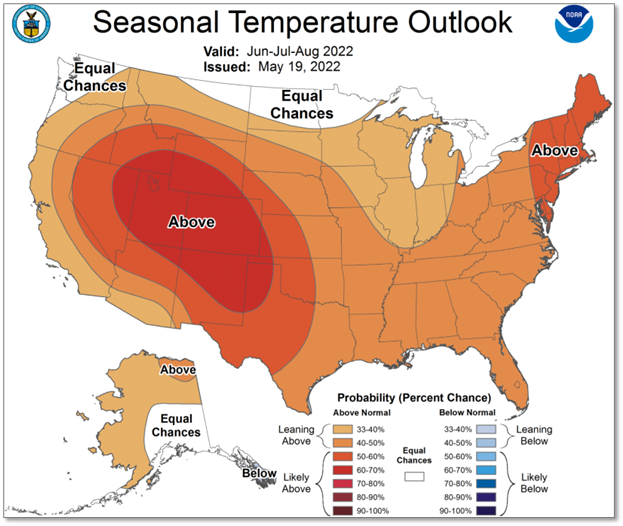
Figure 3: Seasonal Temperature Outlook Issued May 19, 2022, from NOAA.com
When looking at all of the possible bullish and bearish influences on this market, the only thing that looks like it might force fear to overcome greed is the growing concern of economic slow-down or recession. During the most recent proxy year of very strong rallies in global energy prices (2008), it was the global recession, in concert with the advent of horizontal drilling and hydraulic fracturing, that produced a bear market and significantly reduced the market price of natural gas. That same overall macro-economic driver could be on the horizon here, but the technology that seems to be the largest player now in the natural gas market is not one that increases production, but instead, it is the rapid expansion and growth of exporting capacity, specifically LNG export capacity. The market is not blind to these things and this may be one of the main reasons we are seeing such a massive drop between this summer and winter’s prices and the future years. A study of open markets and group-think economic theory leads many to the belief that these risks are already priced into today’s forward curve. We would have a hard time arguing against that belief.


