
Over the last few years, natural gas has become the fuel on the margin, meaning that the price of natural gas becomes the driver for wholesale electricity prices. Supplies of natural gas and the delivery systems necessary to transport that gas are both important factors that influence the price of electricity. Given the size of PJM, it should not be surprising that the forces affecting electricity prices in the eastern portions of PJM are different from those affecting prices in the western part of PJM. In August, a major interstate gas pipeline on the TETCO system in rural Kentucky exploded. Electricity markets in the eastern and western parts of PJM had significantly different responses to this explosion.
Electricity markets in eastern PJM have rallied since the TETCO pipeline explosion. Figure 1 shows the wholesale prices for electricity at the PJM East trading hub (near Philadelphia) for calendar years 2020 through 2023. This chart shows that wholesale prices climbed through last winter and then began to fall in March. All calendar years hit a floor after the 4th of July holiday and then began to rally. The gas pipeline explosion in early August turned what was a mild rally into a distinct bullish trend across all calendar years. The pipeline accident had the biggest effect on calendar year 2020 prices which increased by 12%, from a low $27.73/MWh to its most recent high of $31.07/MWh. Prices for 2021, 2022 and 2023 increased by 8% to 10% over that same period.
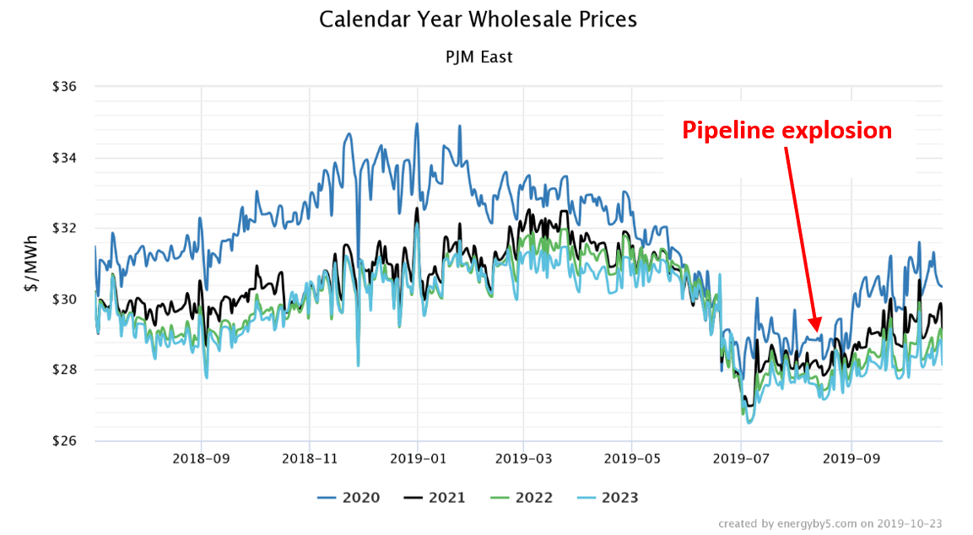
Figure 1: Calendar Year Wholesale Prices PJM East, by 5
Electricity prices in the western part of PJM had little or no reaction to that pipeline accident. Figure 2 shows wholesale prices for electricity at the Chicago trading hub (ComEd) for calendar years 2020 through 2023. Note that the price trends are similar to PJM East, where wholesale prices began to fall last spring and hit their bottom in the beginning of July. While there has been a slight rally since the first week of July, it has not been as strong as in PJM East and there was very little response to the pipeline explosion, as the price for calendar year 2020 has only increased by 6% from its low. Most traders believe that that slight rally observed in prices in the western part of PJM are simply the market’s response to the rapid sell-off that occurred between March and July.
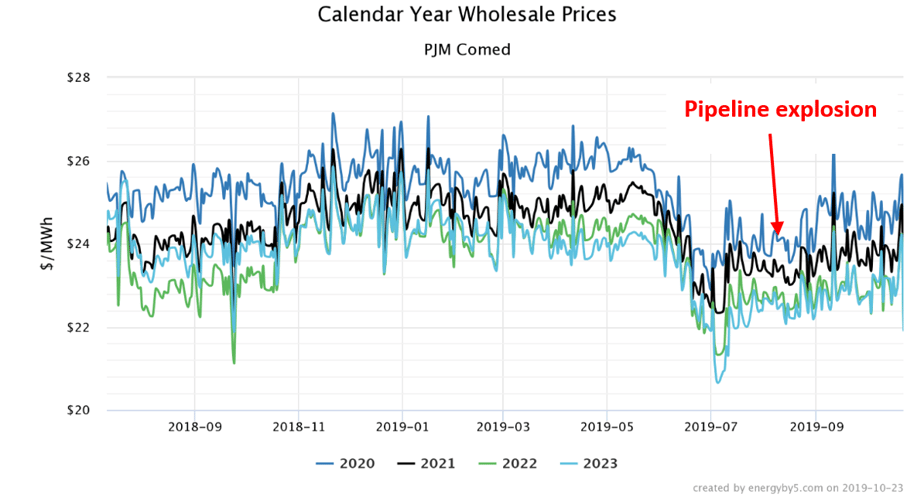 Figure 2: Calendar Year Wholesale Prices PJM ComEd, by 5
The differences in price response to the pipeline explosion are due to the fact that gas supplies in the western part of PJM are delivered through the ANR pipeline system while a significant portion of the gas supplies in the eastern part of PJM are delivered through the TETCO system where the pipeline rupture occurred. There are several large intrastate pipelines that feed PJM: NGPL and ANR to Illinois and Ohio, as well as TETCO and TRANSCO to the east. While PJM is a single electricity market, prices at each of its many trading hubs are highly contingent on the specific intrastate pipelines that supply the natural gas.
Despite the fact that prices have rallied in PJM East, on the whole, futures prices remain favorable. Figure 3 shows the 4-year historical trading range for calendar years 2020 to 2024 in PJM East. The height of the green bar is the range of high and low prices for a given calendar year over the last 48 months. The black bar is where wholesale prices are currently trading. Note that for all calendar years, prices are in the bottom quartile of its trading range. Additionally, prices get less expensive with time – these are good purchasing signals. While wholesale prices have rallied lately, market conditions remain favorable for future power purchases.
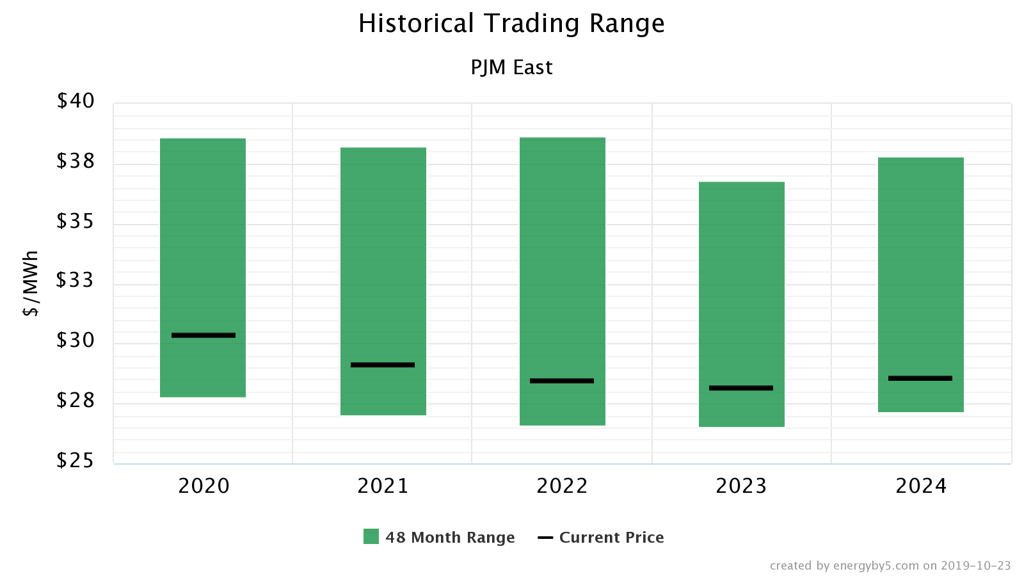 Figure 3: Historical Trading Range PJM East, by 5


