Earlier this year, we wrote an article describing the rapid acceleration of price volatility in the natural gas markets, with a chart that showed daily price movement at the Henry Hub, the national benchmark trading hub for natural gas. In this chart, shown in Figure 1, the y-axis is the daily price change in natural gas prices over the last ten years. A negative number means the price went down and a positive number means the prices increased during that day’s trading session. This chart shows that since the summer of 2021, there is a higher degree of scatter among the data points, indicating that gas prices have become increasingly volatile over the past 12 months. One interesting feature that this data shows is this volatility has not been predominantly in one direction, or skewed to either the upside or downside, rather, it has been evenly distributed around the mean.
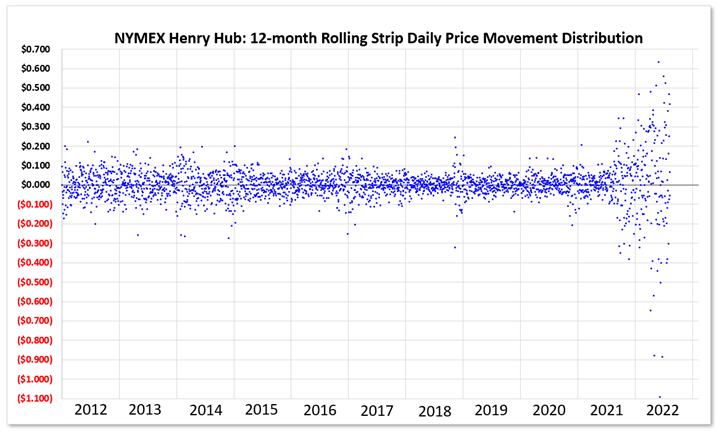
Figure 1: Day-over-Day Price Change in the NYMEX Henry Hub 12-month rolling strip price over the past 10 years from 5
We have also reported on recent trends in natural gas storage levels, and how those storage levels have been consistently below the five-year average. The black line in Figure 2 shows the five-year average of the amount of natural gas in storage by month; the red line shows how storage levels have changed in the first eight months of 2022. Notice the consistency in the gap between the black line and the red line. This consistent deficit most closely parallels the gap in 2018 (yellow line), making 2018 the best proxy year when looking to compare prior storage levels to the present.
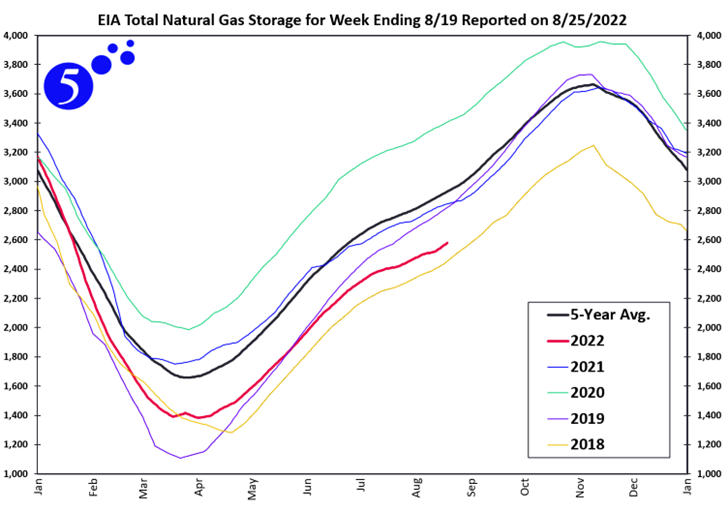
Figure 2: Weekly Storage Levels for the past 5 Years from 5
The problem in comparing storage levels to 2018, or any other year in the past, is that recent prices are not even close to comparable to anything in the recent past. The data in Figure 3 shows how prices have been related to storage levels over the last nine years. The x-axis in Figure 3 shows the difference between that week’s actual storage level and the five-year average; prompt month gas prices are on the y-axis.
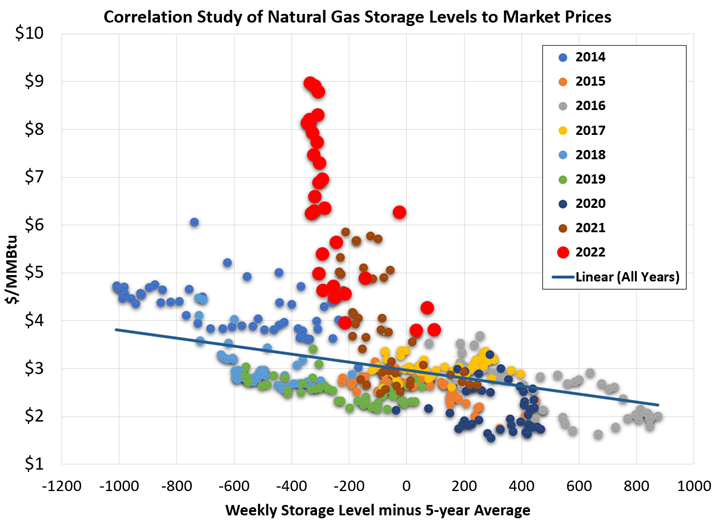
Figure 3: Correlation Study of Natural Gas Storage Levels to Market Prices
This chart shows that for all years from 2014 through 2021, there is a fairly well-fitting linear correlation between price and storage levels, with most years either trending to more of a surplus, driving prices lower, or trending to a tighter market with supply levels decreasing and prices escalating. This year, that correlation seems to have completely broken down. All weeks since late January have had a deficit of between -223 and -332 Bcf with prices that have varied from $4.00 to over $9.00 per MMBtu. Even though there were similar storage level deficits in 2018 (light blue) and 2019 (green), for most weeks during those two years, prices were low and trending just below the line in Figure 3.
If one were to only use historical prices and storage levels to predict current price levels, one might expect prices to range between $3.00 and $4.00 based on what is modeled in the data from 2014 to 2020, and perhaps as high as $4.00 to $6.00 if including 2021. This is clearly not the case in 2022 as there does not appear to be any correlation between price and storage levels. However, it is interesting to note that the forward market is trading in that $4.00 to $6.00 per MMBtu range for most months between April 2023 through December 2026 as shown in Figure 4.
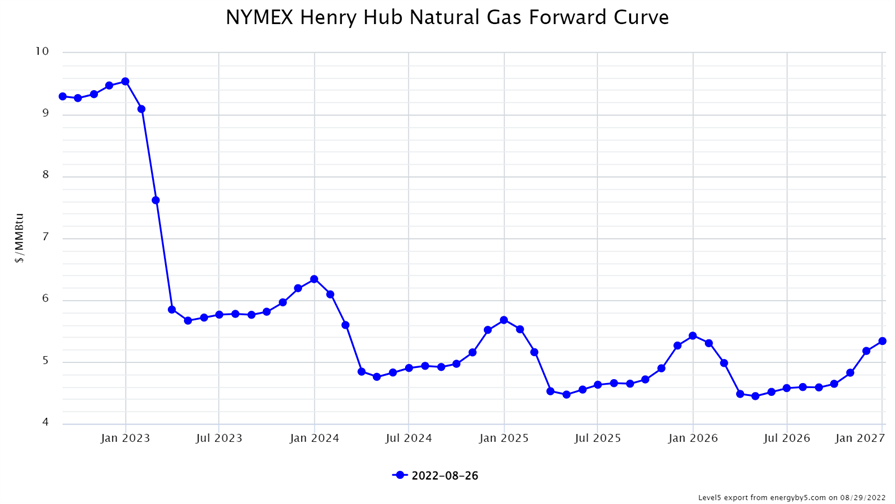
Figure 4: NYMEX Henry Hub Natural Gas Forward Curve from 5
This disconnect between storage levels and natural gas prices is an excellent illustration, showing how normal market fundamentals do not seem to be in control of this market and how extreme price volatility has remained unabated. These factors make it very difficult to predict where the market might go from here. Perhaps there are drivers in this market that are less concerned with the amount of actual commodity inventory levels and are now more focused on price trends, trading opportunities, and technical analytics, at least for the balance of this year and this coming winter.