Often in commodity trading, it isn’t always the straight-forward market drivers that catch the market off guard. Rather it’s the counter-intuitive things that seem to side-swipe a market. Lately, there has been a negative correlation between the price of crude oil and the price of natural gas. This summer, a decrease in the price of crude oil has coincided with a rally in natural gas prices. This month, the inverse relationship between these two commodities will be examined in more detail.
Over the summer, prices at the West Texas Intermediate (WTI) and Brent crude oil trading hubs (the world’s two largest crude oil trading hubs) have decreased by about $40 per barrel, with WTI spot prices falling from over $120 in early June to below $80 last Friday for the November delivery month. Fifteen to twenty years ago, one would expect this to be very bearish to natural gas prices as these two commodities often traded in line with one another. Today, this is no longer the case.
A shift in where domestic natural gas is produced is the reason why these two commodities seem to move in opposite directions at the extreme ends of their price ranges. Twenty years ago, a significant amount of both crude oil and natural gas came from offshore wells in the Gulf of Mexico. Today, with the full implementation of horizontal drilling and hydraulic fracturing, onshore shale reserves have replaced the Gulf of Mexico as the largest source of the nation’s hydrocarbons.
The Permian Basin, located primarily in West Texas, is the nation’s largest oil-producing region and has turned Texas into the 3rd largest producer of oil, behind only Russia and Saudi Arabia. In 2021, these massive crude oil reserves pushed the United States into the lead as the world’s highest oil-producing nation at almost 12 million barrels per day. Significant amounts of natural gas are extracted as a byproduct of crude oil production, meaning growth rates in crude oil-producing regions like the Permian Basin also increase natural gas production rates.
In 2008, the Permian Basin produced less than 1 Bcf/day of natural gas, or just under 1% of domestic daily production. By May 2022, that figure increased to 14.4 Bcf/day, which is nearly 15% of the nation’s daily production. Almost all of that natural gas came from crude oil wells. So much gas comes from crude wells, that as of May 2022, there was only one active drilling rig in the Permian that was solely directed towards natural gas. The Permian Basin has become the nation’s second-largest natural gas play (see Figure 1) because of all the natural gas that is a byproduct of crude oil production.
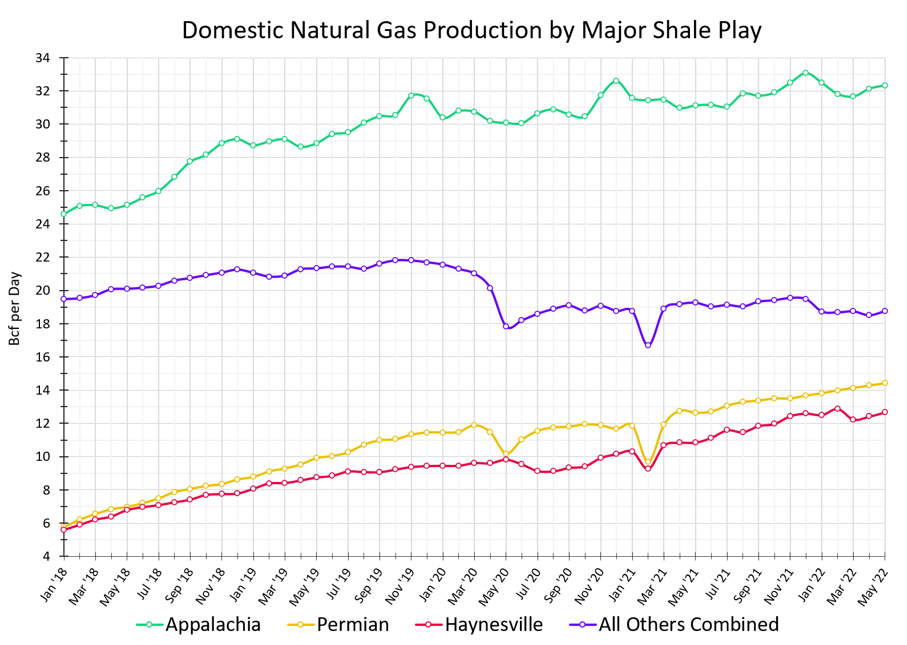
Figure 1: Domestic Natural Gas Production by Major Shale Play from 5
The risk that the natural gas market has to crude oil production in the Permian basin is that if crude prices drop enough, it will slow the investment and the production of natural gas in the Permian Basin. This would reduce output from one of only two natural gas reserves in the US that is growing over the past year. Something similar occurred in the late spring of 2020. When crude prices tanked, oil production rapidly decreased and natural gas production in the Permian dropped by 2 Bcf/day over two months. Few outside of the industry anticipated the effect that decreased crude oil production would have on future natural gas prices. This is why natural gas prices for calendar years 2021, and to a lesser extent 2022, rallied significantly through the spring and summer of 2020 (see Figure 2), while the rest of the forward curve stayed relatively discounted, trading below $2.60 through the winter of 2021.
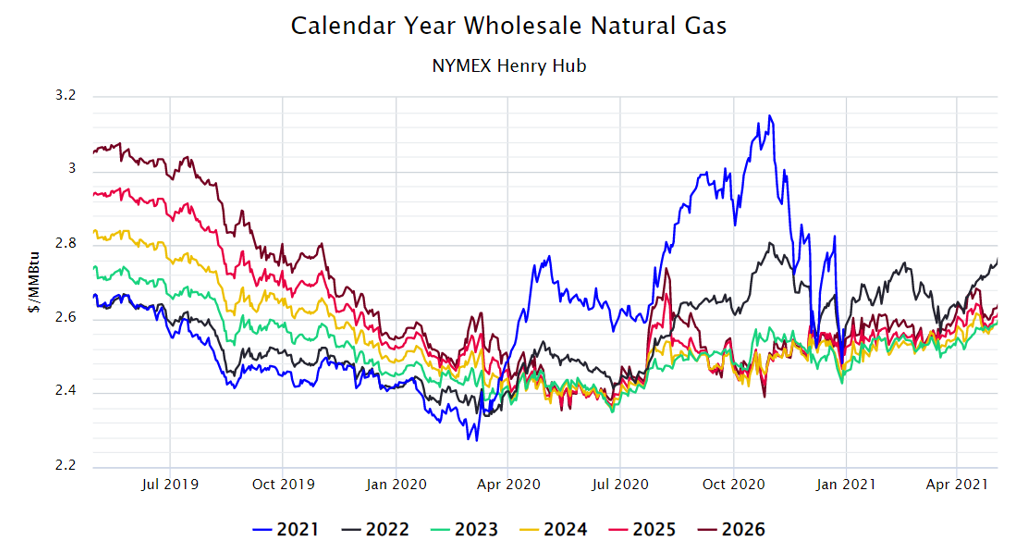
Figure 2: Calendar Year Wholesale Natural Gas NYMEX Henry Hub from 5
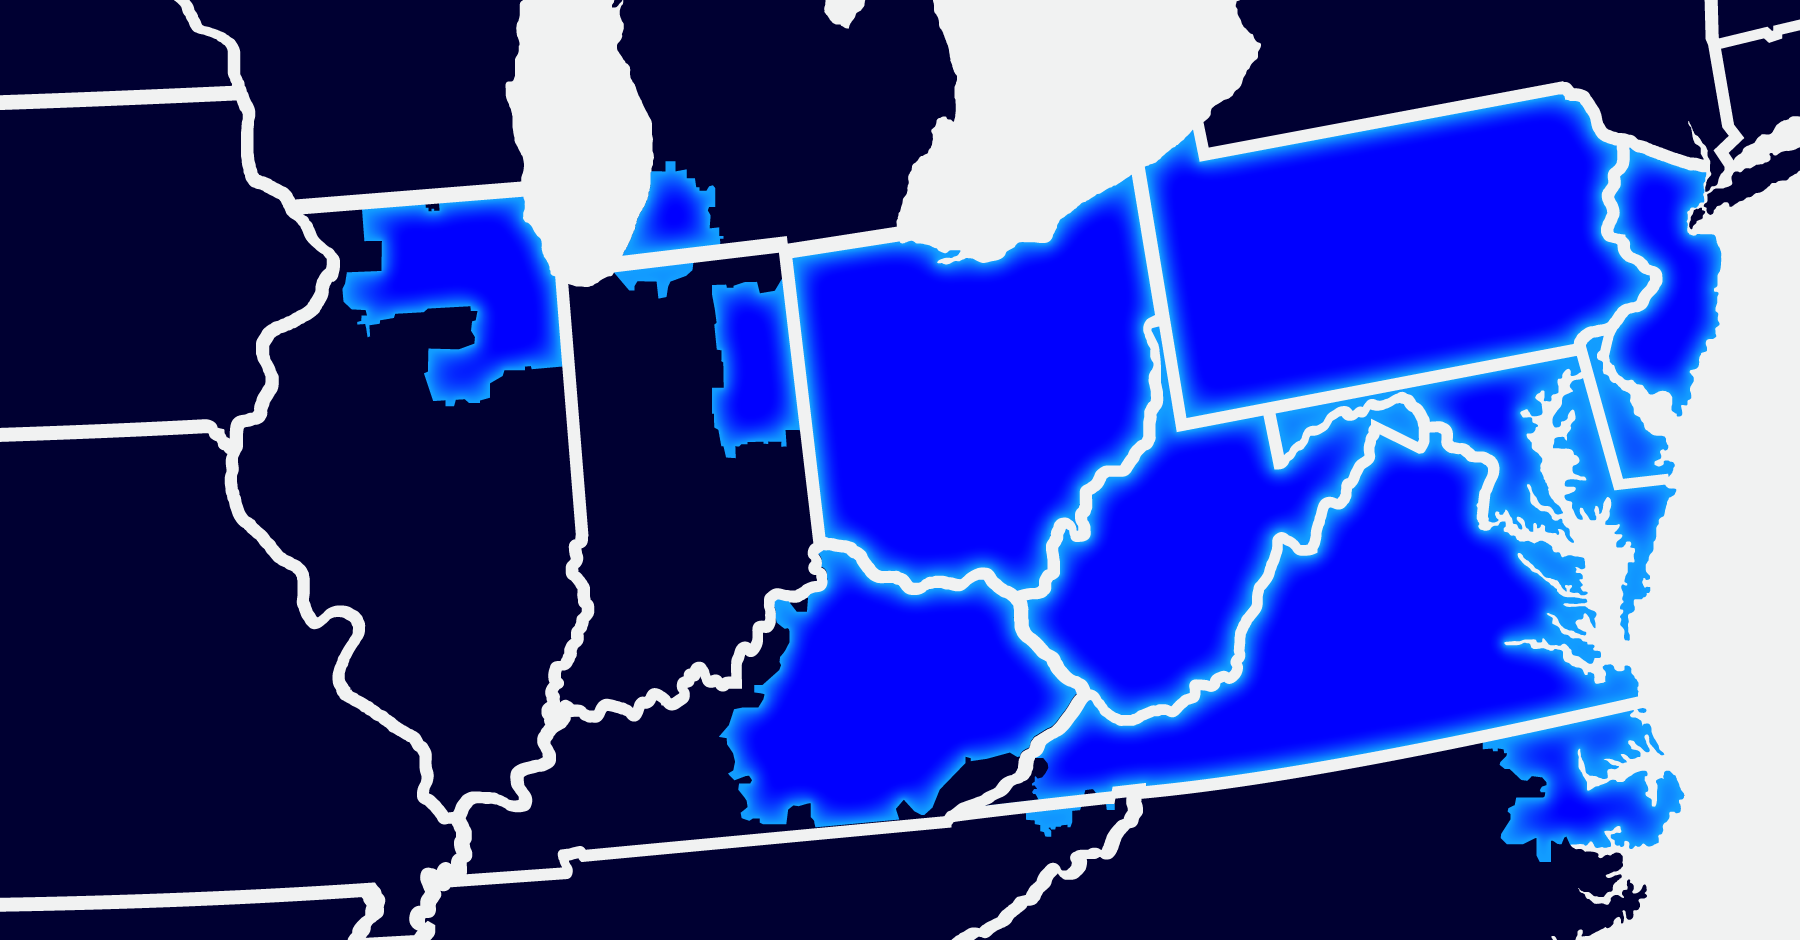
Natural gas rig counts show (see Figure 3) that only the Haynesville play in East Texas and Northern Louisiana is expanding production through capital spending on drilling activity. The nation’s largest gas producing region, in Appalachia, which includes both the Marcellus (purple line) and the Utica (orange line) shales, has actually seen a reduction in rig count over the last several months. This may seem a bit counterintuitive given what appears to be a sustained demand for natural gas both domestically and overseas.
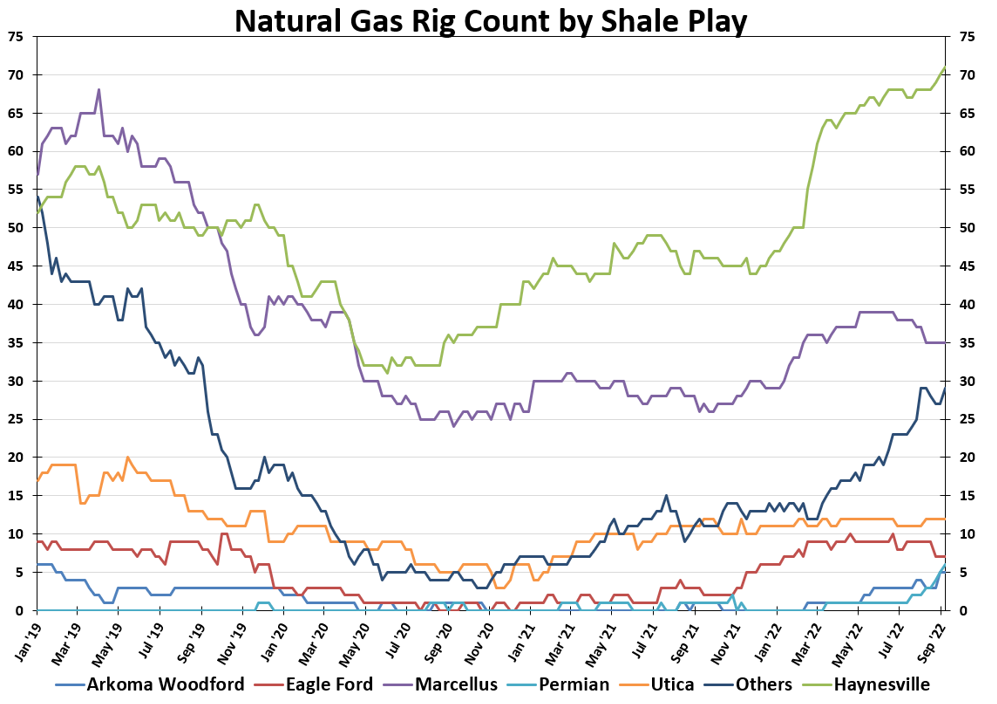
Figure 3: Natural Gas Rig Count by Shale Play from 5
This suggests that even though spot natural gas prices over the past few months have been at their highest price points since 2008, few natural gas producers are reinvesting in the traditional plays. Rather, these producers are increasing their focus on improving their balance sheets and increasing production near the newest demand center, and it’s no accident that this is in close proximity to the majority of the LNG export terminals. One only has to “follow the money” to see that natural gas production is expanding in a way that will ramp up our export capacity of LNG instead of increasing production in the Midwest or the Northeast, where prices this winter are likely to reach record highs.
Figure 4 shows that there has been a recent decrease in natural gas prices. And while the recent sell-off across the entire forward curve might be viewed as a sign of market weakness, we would advise buyers who have not yet hedged their natural gas price exposure for the coming years to capitalize on this market movement. Figure 4 also shows that prices from 2024 through 2028 are currently trading at or below $4.75/MMBtu, which is a good price point to consider making additional purchases in those years.
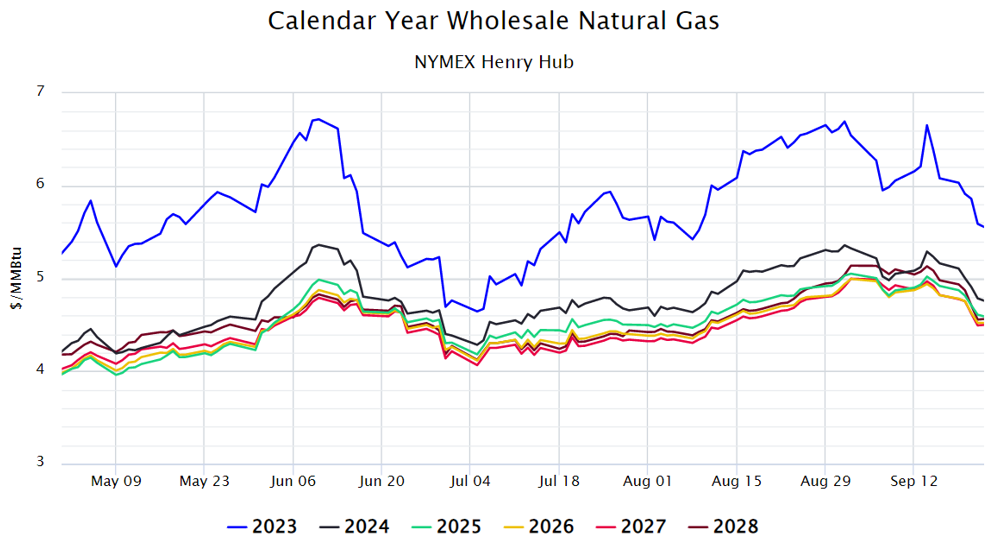
Figure 4: Calendar Year Wholesale Natural Gas NYMEX Henry Hub from 5