One of the most utilized pieces of fundamental analysis in the natural gas industry is the Energy Information Agency’s (EIA) Natural Gas Storage Report, which is released every Thursday morning at 10:30 ET. This report summarizes the results of a weekly survey of most natural gas storage facilities across the US and shows how much natural gas the nation has in storage. It also gives a regional breakdown, along with a reference to normal storage levels for each week of the year as shown in Figure 1. Many industry analysts use this data and the amount of natural gas in storage compared to what is normal (the 5-year average is commonly used) to understand and forecast natural gas prices.
The data in Figure 1 shows current inventory levels and how that compares to the amount of domestic natural gas that is in storage. This provides tremendous insights into the supply-side economics that drive the price of natural gas. Additionally, any consensus in forecasts of storage levels gives an indication of what the market believes will happen over the next few weeks or months.
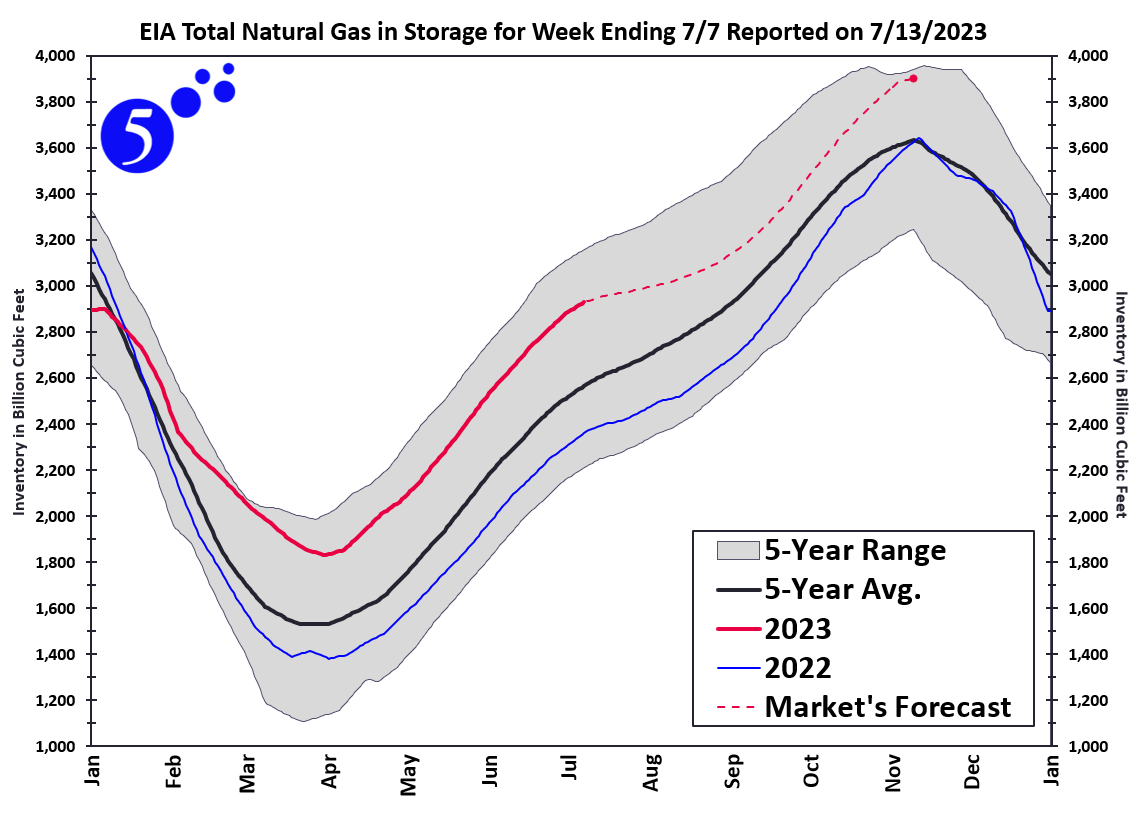
Figure 1: EIA
Currently, the EIA reports a total storage capacity of about 4,250 billion cubic feet (Bcf). Typically, in the spring, that inventory draws down to between 1,200 to 2,000 Bcf, and then through the spring through fall it builds back up to between 3,200 and 4,000 Bcf. Last year (the blue line in Figure 1), storage levels were trending below the 5-year average from late February until November. Most of the market’s price premium was not necessarily based on where the levels were, but where they were projected to be by the end of the injection season in October. The warm winter beginning in late December drove the red line (this year’s levels) significantly above the 5-year average, with a consensus forecast to end the winter withdrawal season somewhere around 3,900 Bcf, which is near the top of the 5-year range. And while 3,900 Bcf seems high, over the past few months, it has been trending lower, and down about 100 Bcf since mid-February.
The forecasted storage number (red dashed line in Figure 1) is based on a number of variables and assumptions related to how market fundamentals will play out. Changes in anything that affects supply and demand across the natural gas industry and the world’s economies will alter that forecast. Here are a couple of the top supply and demand drivers that analysts watch.
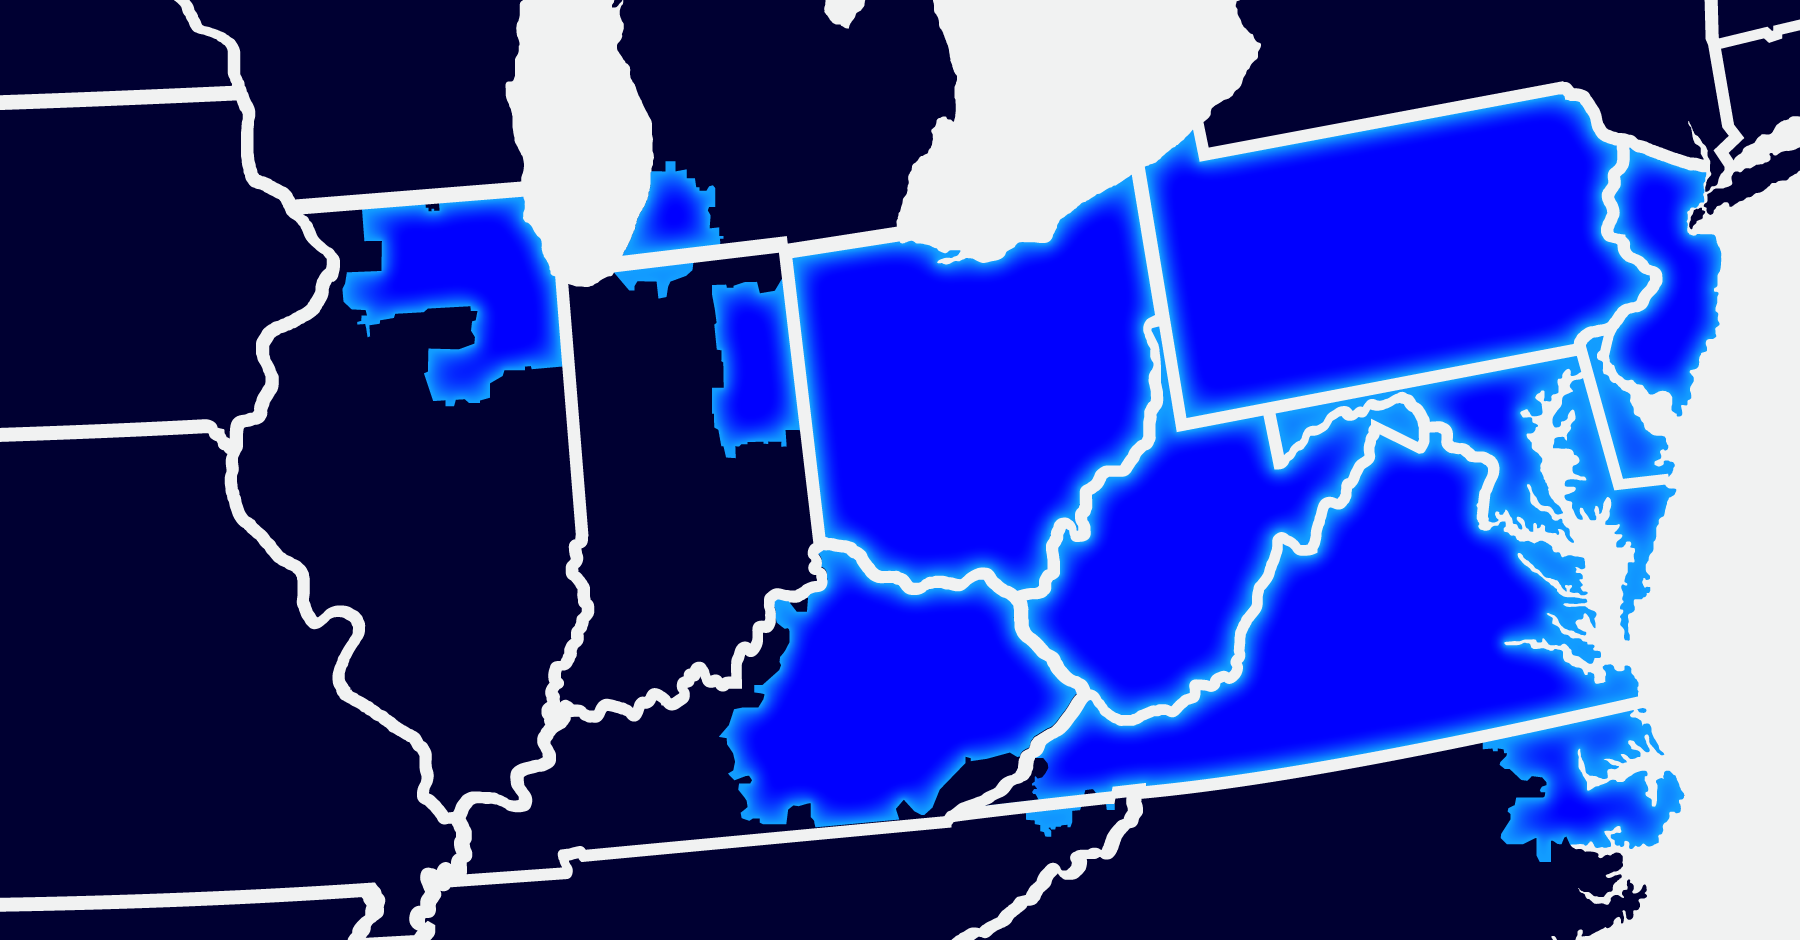
The natural gas rig count is probably the biggest signal of what drillers of natural gas are doing in reaction to market prices and costs. Baker Hughes releases a weekly report on the total number of active drilling rigs across North America, which is in Figure 2. This chart shows the count of active rigs drilling for natural gas, since January 2021, in the major domestic natural gas basins. Haynesville is in East Texas and NW Louisiana, the Permian is in West Texas and New Mexico, Eagle Ford is in South Texas, and the Marcellus and Utica are in the Appalachian region across Western Ohio, Pennsylvania, and West Virginia.
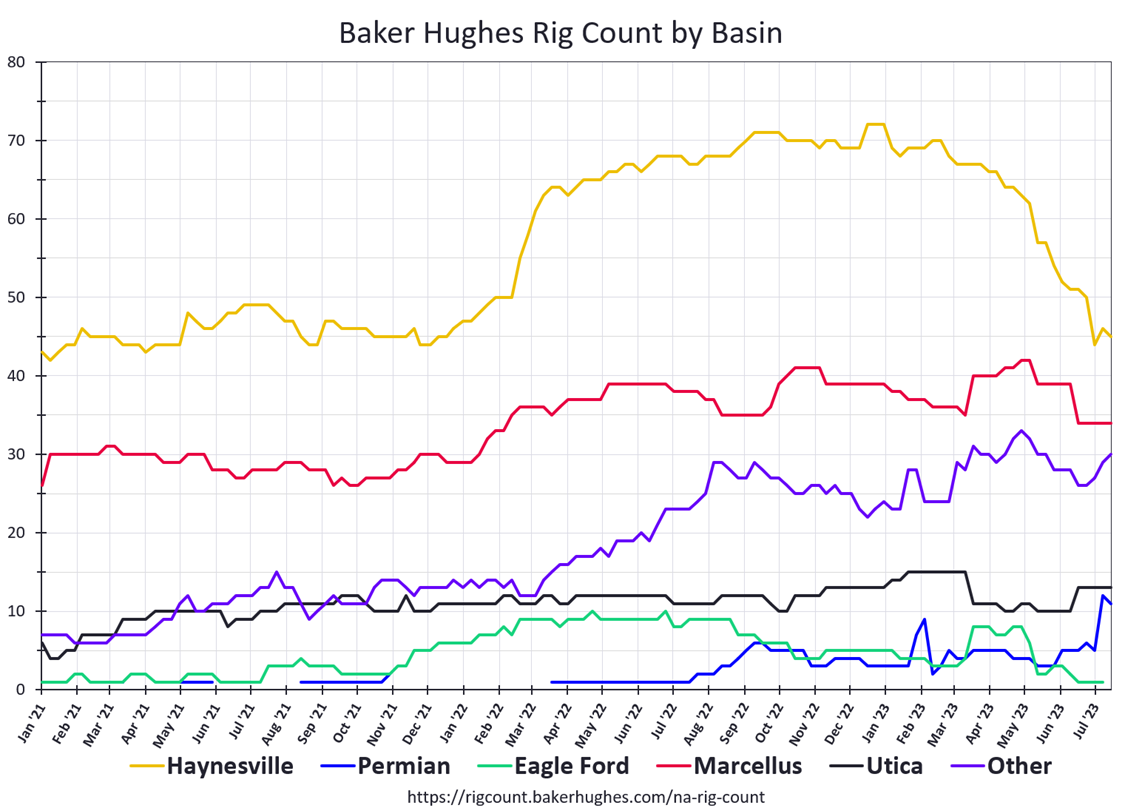
Figure 2: Baker Hughes
When Russia invaded Ukraine in the spring of 2022, prices for natural gas began to rally. One can see that rig counts in Haynesville rose rapidly, with modest increases in the Permian, Marcellus, and other gas-producing regions. Since February of this year, Haynesville has decreased its rig count by about 25 rigs, and the Marcellus is back down to its pre-Ukraine war rig count. In the first half of this year, most rig counts are down with small increases in the New Mexico side of the Permian Basin and in other regions over the last couple of weeks. This report gives analysts a good indication of how busy producers are at drilling for new supplies of natural gas, the main influencer of the supply side of the supply/demand curve.
The demand side of the equation is harder to track, but during the summer, one of the easiest trends to follow, and one that consumes the most natural gas in the US is the EIA’s tracking of natural gas consumption for electricity generation (See Figure 3).
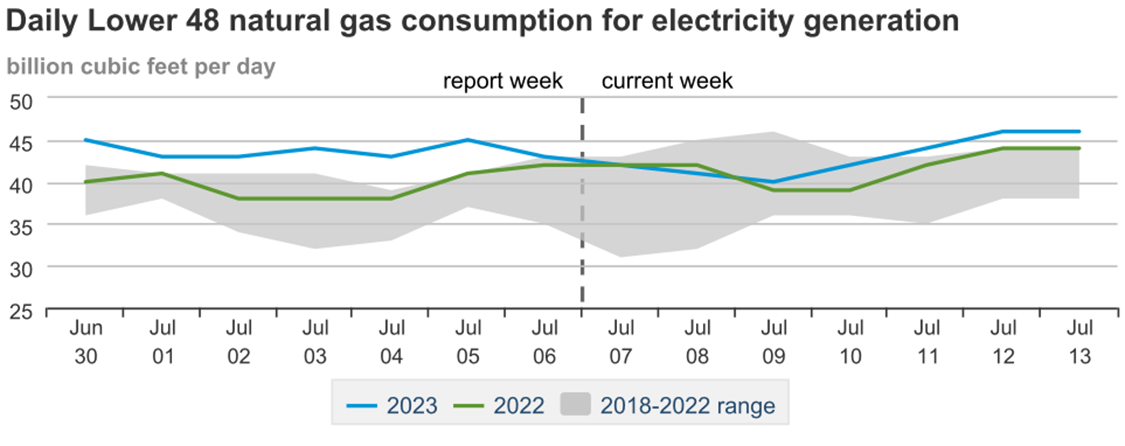
Figure 3: EIA
While natural gas consumption for most of June was normal from a national perspective, July has been trending above the 5-year range. This statistic is significant, considering that most of the warmer temperatures across the US this summer have been concentrated over Texas and the West where the amounts of solar and wind generation have dramatically increased in the last 5 years.
Lately, the two forces of natural gas supply and demand seem to be opposed to each other. Falling rig counts in the major gas-producing regions increase the probability that storage levels will decrease due to lower production levels. One would expect that this, coupled with above-average demand for power generation would drive up natural gas futures. However, since the hot weather this summer is concentrated in regions where wind and solar are significant power-generating assets, natural gas demand has been lower than what was expected. These offsetting forces have stalled the forward market for natural gas. Figure 4 shows the wholesale price of natural gas for the winter of 2024, and since its rapid fall, beginning in December 2022, the price has bounced off its bottom of $3.50/MMBtu twice and is currently trading near $3.60.
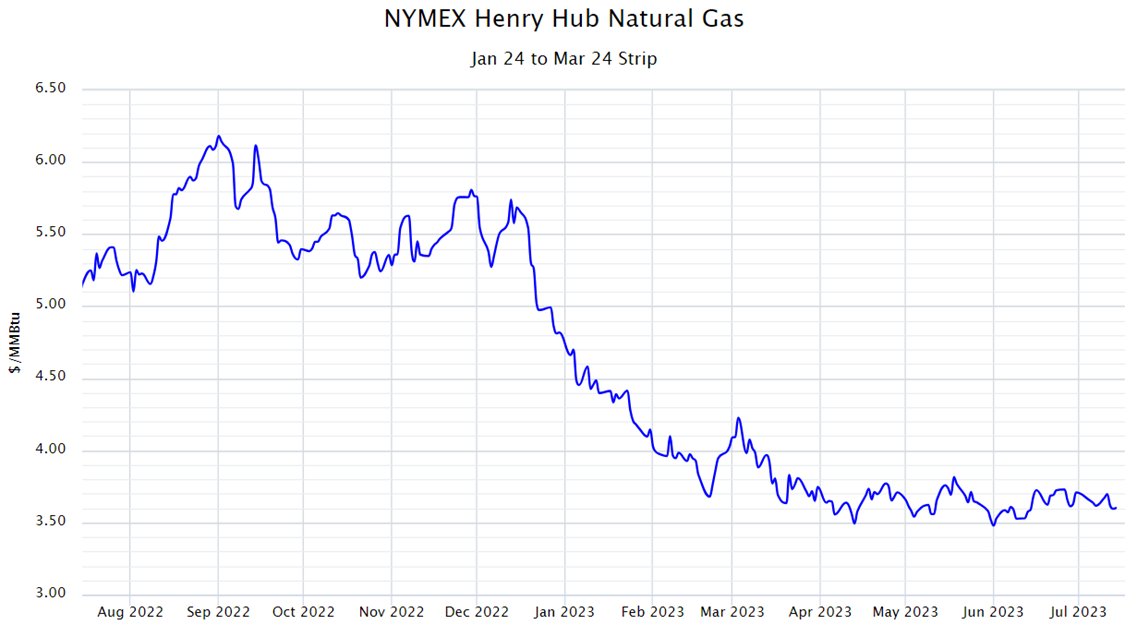
Figure 4: By 5
And until something starts to push the supply/demand equation to one side or the other, natural gas could remain in this flat/horizontally traded market. Sooner or later a market driver will present itself, grab the market’s psyche and either push the market up with bullish horns or smack it down with bearish claws. Today, no one is sure what will break through this stalemate.