There is no doubt that the rapid growth of utility-scale solar in Texas has helped the state meet its ever-increasing electricity demand during hot and dry summer afternoons. The 10X increase in solar capacity in ERCOT over the past five years has kept summer afternoon peak prices in check, contributing to almost 6% of ERCOT’s total power this year (over 17 million MWh of emission-free power). But all that shimmers in the West Texas sun is not gold, and as California is learning, solar alone will not solve the state’s capacity problems.
California has similar issues with solar power during the late afternoon hours. Figure 1 shows how solar output peaks at midday and starts to trail off after 4 pm. This chart shows that additional generation is required late in the afternoon and evening hours to keep up with demand as solar output decreases with the sun setting.
This chart, which shows the relationship between Net Load (load inclusive of renewable generation) and the amount of demand on the power grid, is commonly referred to as the “duck curve” because its shape resembles the neck and head of a duck. This rapid growth in Net Load in the afternoon and evening must be satisfied by means other than renewable generation. Additionally, the slope and magnitude of the ramp-up of Net Load show that a significant amount of rapidly deployed generation is required to produce electricity for a few hours of demand.
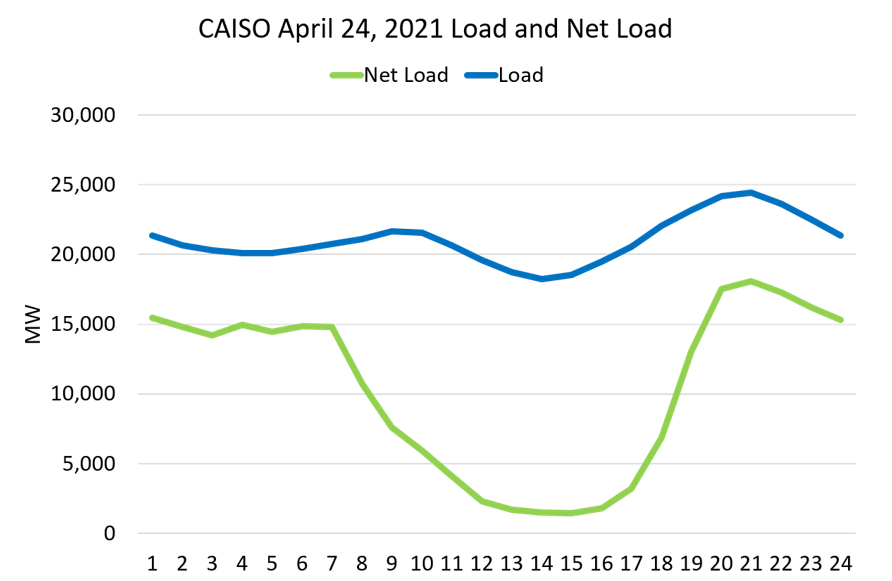
Figure 1: CAISO April 24, 2021 Load and Net Load from enerdynamics.com
Texas does not have the same amount of solar capacity as California. Additionally, ERCOT’s total system demand is almost twice the amount of the CAISO (California’s ERCOT equivalent), which makes ERCOT’s duck curve not as pronounced (think of a flatter duck) as it is in California – for now.
Traditionally, ERCOT’s highest-priced hour has coincided with the highest demand hour, between 4 and 5 pm, or in ERCOT lingo, Hour Ending 17:00 (HE17). But that is starting to change.
As the state increases its solar capacity, there is less risk in that peak hour of scarcity pricing. Instead, the peak price hour shifts to later in the evening, typically to the Hour Ending 18:00 or 20:00 (6 to 8 pm). Over the last two years, in the late summer months (August and September), there were multiple days where prices were higher in HE 18 and 19 than in HE 17. Events from this September illustrate the shift that is happening in Texas.
ERCOT has two distinct auctions that market participants use to buy and sell power in Texas. The one most quoted and talked about is the Real-Time Market, which is run in 5-minute intervals by ERCOT. The Day-Ahead Market auction occurs the day before power flow and is used by traders to mitigate the risk and volatility as it tends to be less volatile than Real-Time Market prices.
Figure 2 shows the hourly day-ahead price for the month through September 26. This chart shows that the Day-Ahead Market’s highest-priced hour was on September 22, from 6 to 7 pm (HE 19), with a price of $297 per MWh. When day-ahead prices spike, there is a distinct “double-hump.” The first spike typically occurs during HE 16 (4 to 5 pm), followed by another spike a couple of hours later.
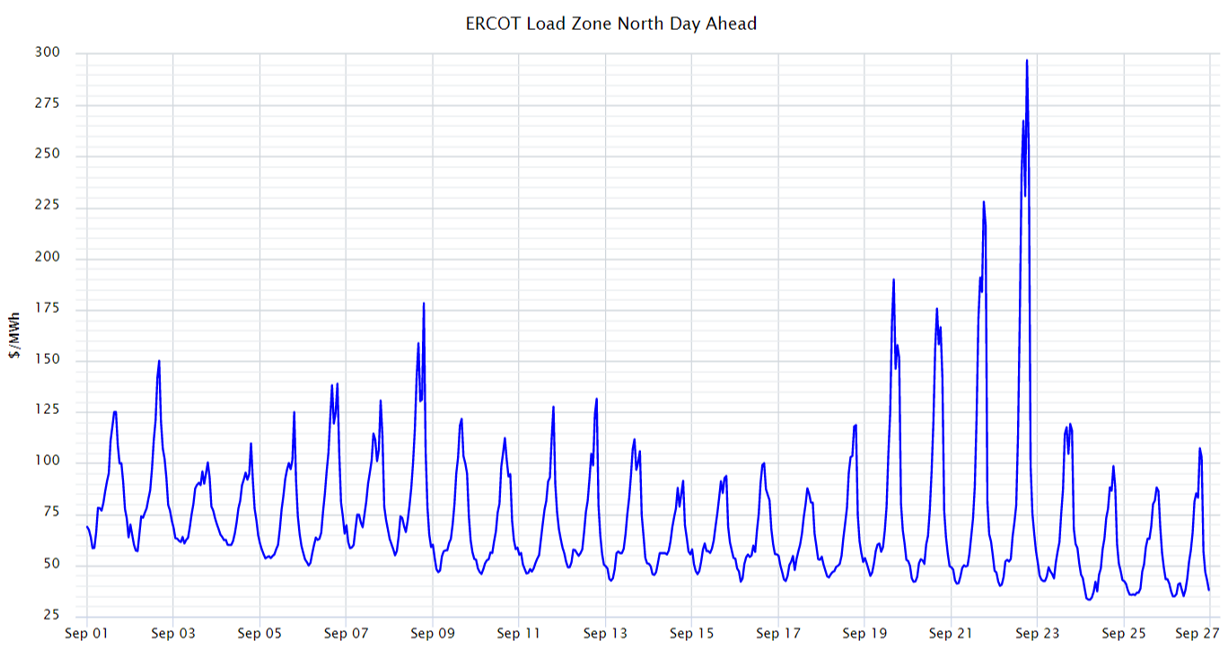
Figure 2: ERCOT Load Zone North Day Ahead from 5
This shows that traders perceive the same risks as in California, where solar energy output decreases faster than demand increases late in the afternoon. This causes a drop in reserve margins to a point where natural gas power plants must come online for a few hours to compensate for diminished solar energy output. This perceived risk is not unwarranted. The Real-Time Market is the one that must ultimately balance both supply and demand. As shown in Figure 3, the three highest-priced hours for the month all fell during the HE 20, with the highest price in the North Zone occurring on September 6, from 7 to 8 pm, with a price of $634/MWh.
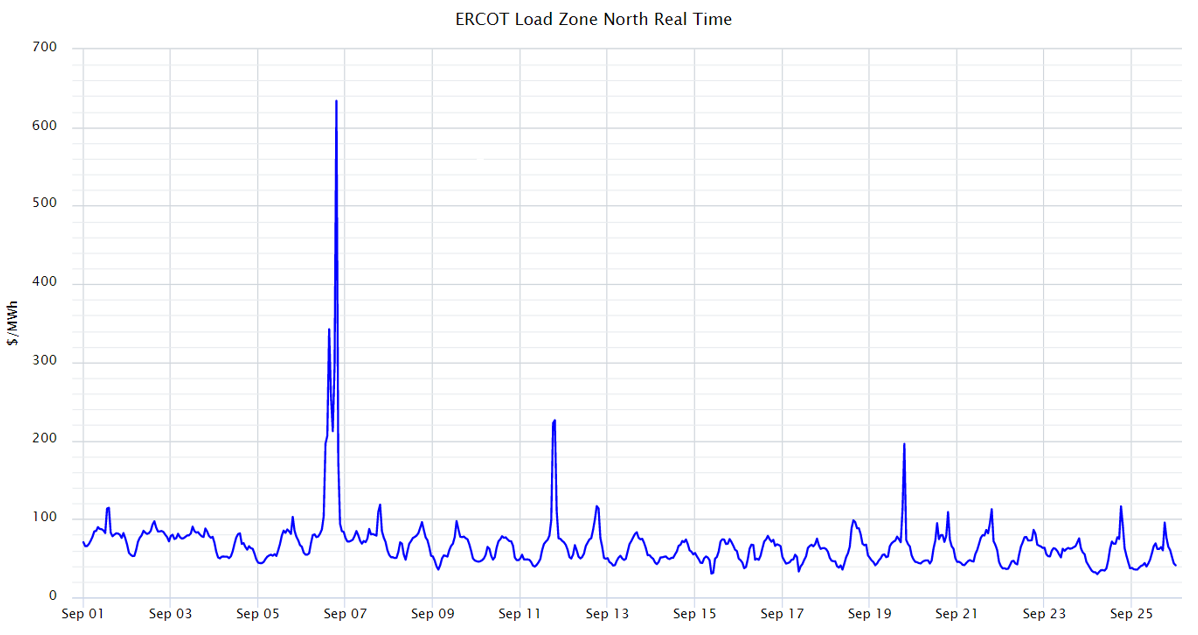
Figure 3: ERCOT Load Zone Real-Time from 5
In Texas, the duck curve is not as distinct or robust as it is in California. However, grid data show that additional generating assets are needed in the late afternoon and early evening hours to account for lower solar output. As new solar assets come online across ERCOT in the coming years, the duck curve in Texas will likely resemble the one in California. Rapid deployment of utility-scale battery projects will help to alleviate this situation in the future. But we’re gonna need a bigger boat, I mean battery, to solve this problem completely.