
Summer has arrived in Texas and electricity customers with a meter whose demand is greater than 700 kW should be paying attention to ERCOT’s peak day/hour forecasts. Taking steps now to reduce power usage during hours of the day when the electricity grid is at its peak will reduce delivery charges in 2021.
While summer officially started last Saturday, the temperatures in Dallas were not waiting for the summer solstice. On Monday, June 8th, and Tuesday, June 9th, DFW Airport recorded high temperatures of 96° F. Figure 1 shows the electricity load throughout ERCOT (in MWs) for each hour in that week.
During the week of June 8 - 12, the peak electricity demand on the grid happened on Monday afternoon (blue line) between the hours of 5:45 to 6:00 PM. Usually, the system peak occurs between 4:30 and 5:00 PM. This later peak could have been caused by a number of factors, but the one that stands out to load forecasters is the lack of the traditional rush hour. With many people still working from home, air conditioning is likely on earlier in the afternoon and without rush hour, that electric load seems to start earlier and sustain longer into the evening. Many who were previously commuting from 5:00 to 7:00 PM are now at home and consuming more electricity through various activities such as cooking and laundry.
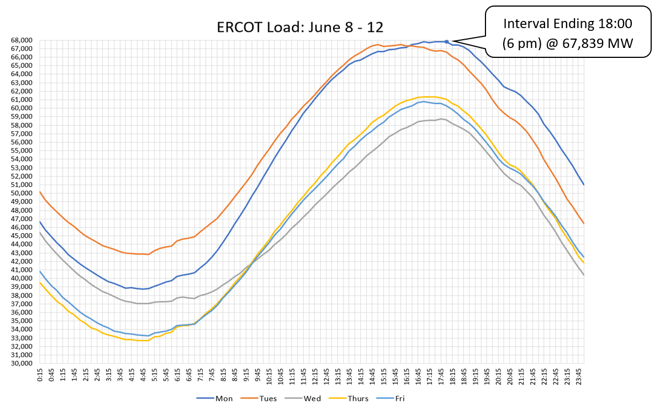 Figure 1: ERCOT Load: June 8 - 12
The next day, Tuesday, June 9th, high temperatures persisted across the state and climbed to a high of 98°F (orange line). Electricity demand grew as the temperatures rose in large metropolitan areas across the state and most forecasters expected the demand on the grid to be higher on Tuesday than it was on Monday. That day, ERCOT’s electricity load, even in the early morning hours, was materially higher than the previous day and trending just as forecasters had predicted. However, the grid hit its peak of 67,498 MWs between 2:45 and 3:00 PM, three hours earlier than the day before. After 3:00 PM, the peak demand on the grid began to fall and was actually lower than when the grid peaked on Monday, even though temperatures were higher.
The one significant difference between those two days was the fact that on Tuesday afternoon, many Retail Electric Providers were predicting Tuesday afternoon to set June’s peak load between 3:00 to 6:00 PM. The load data shows that this call for optional curtailment was successful.
The load response shown in Figure 1 offers a glimpse into a new dynamic where electricity customers are voluntarily responding to the predictions of load forecasters. At the same time, this voluntary load response and shift makes it more difficult to predict actual system peaks. We will continue to report on how load patterns are shifting throughout the summer and how to capitalize on these opportunities to reduce peak demand and keep delivery charges down for 2021.


