What is Driving the Extreme Volatility in the Natural Gas Market?
The NYMEX Henry Hub prompt month future contract continued to push the volatility envelope this past month, with the daily change for August delivery exceeding $0.37/MMBtu. This is significant because the average daily change over the previous twelve July’s average was approximately $0.05, with a maximum average daily change of $0.08 back in 2012 (See Figure 1). Last month, we wrote about the explosion at the Freeport LNG plant south of Houston, Texas, and how it affected both international and domestic prices for natural gas.
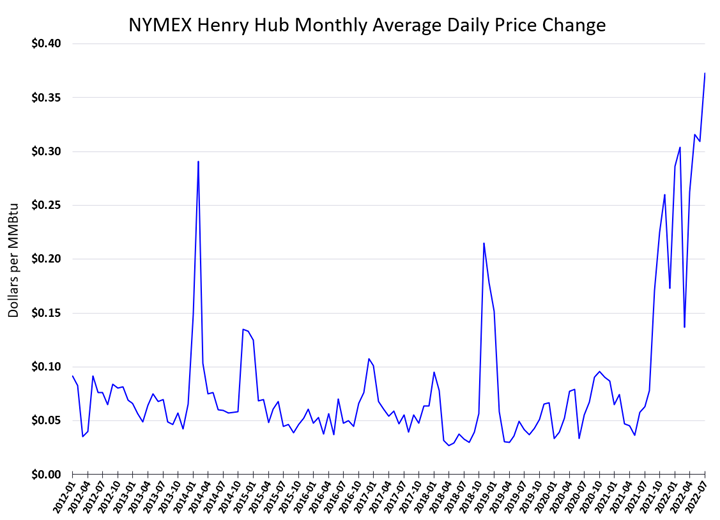
Figure 1: NYMEX Henry Hub Daily Price Change from 5
This month, it seems natural gas traders have moved on from the newfound gas supply caused by the idling of the Freeport LNG plant and have focused their attention squarely on more bullish drivers of the market. From June 8, 2022, the day that Freeport was shut down, through the end of June, the August delivery contract sold off from around $9.50 down to just below $5.50 on June 30. Once July started, it seemed like the excess 2.1 Bcf/day of natural gas that was no longer being liquified was no longer front and center, and instead, the market was focused on the excessive heatwave settling in over the middle of the country. By the morning of July 26, the penultimate trading session of the August contract, gas prices were trading as high as $9.75, a full $4.25 upward movement since June 30 (See Figure 2).
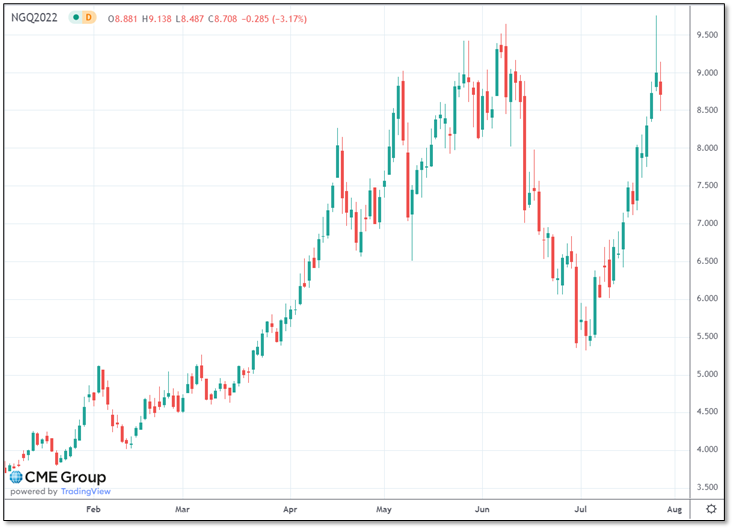
Figure 2: NYMEX Henry Hub August Contract with Daily Bars from cmegroup.com
What were the market forces that drove a $4.25 increase in natural gas during a very warm summer month? In 2021, the EIA reported that 784 Bcf were consumed in the US for power generation in the first 20 days of July. For the same period in 2022, that number was 874 Bcf, a difference of 90 Bcf or about 4.5 Bcf/day more during the first 20 days of this July compared to last year. That is over 2X the surplus of natural gas from the capacity of the idled Freeport LNG plant, which is only about 2.1 Bcf/day. And as we approach the end of July, the August contract closed for its final settlement on Wednesday at $8.668, just under June’s recent high of $8.908 (See Figure 3).
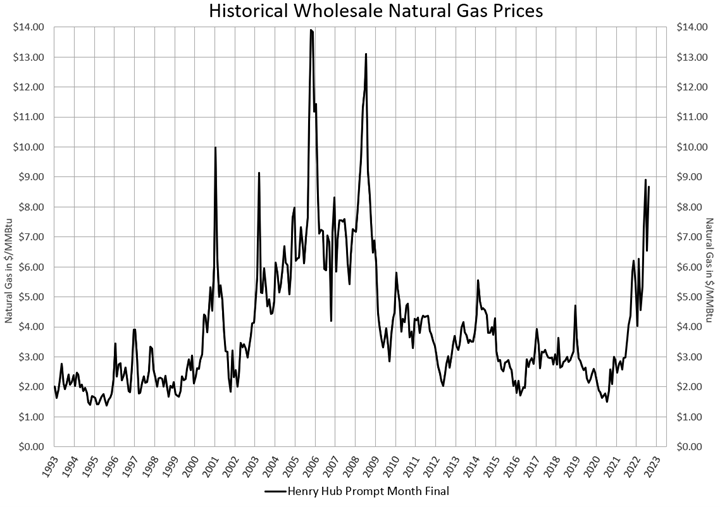
Figure 3: Henry Hub Prompt Month Price, 1993 - 2022 from 5
With all the bullish drivers affecting the natural gas market in July, there are at least a couple of objective silver linings that buyers can take from this market. First, it appears that the market may have found a strong resistance level (ceiling) of about $9.50/MMBtu. The rally on July 26 and its subsequent retracement is a strong signal that the market seems to run out of buyers quickly when it gets above $9.00. The downside support (floor) of the market seems to be in the $6.00 to $6.50 range (See Figure 2), which suggests that this market should look for a consolidation (area to trade within) between $6.50 and $9.00 until there is new market news that drives us out of that range, either to the upside or downside. It will likely take quite a bit of market “energy” or news to push us outside that consolidation range given how large that range is, and the apparent strength of those support and resistance levels.


