
New York’s Power Spot Market Clearing Extremely Low
In April 2019, Real-Time spot prices, or index prices, for electricity settled lower than typical for the month ofApril. These price trends are shown in Figure 1. This chart shows the spot price in various regions of New York over the last year. The letters in chart’s legend correspond to different geographic regions of the state (see map in Figure 2). The settlement prices in April were more in line with typical prices for May and June when index prices are usually at their lowest.
This trend continued into May, with the average settling price for many parts of New York near all-time lows. In upstate New York, the month of June has been following the trend that began in April with settlement prices that continue to decrease. Settlement prices downstate are holding steady and close to May’s settlement price. The only outlier is in Long Island (Zone K), where June’s spot price settlement has increased significantly. A tabular summary of the spot electricity settlement prices across the various regions of New York over the last three months is in Table 1.
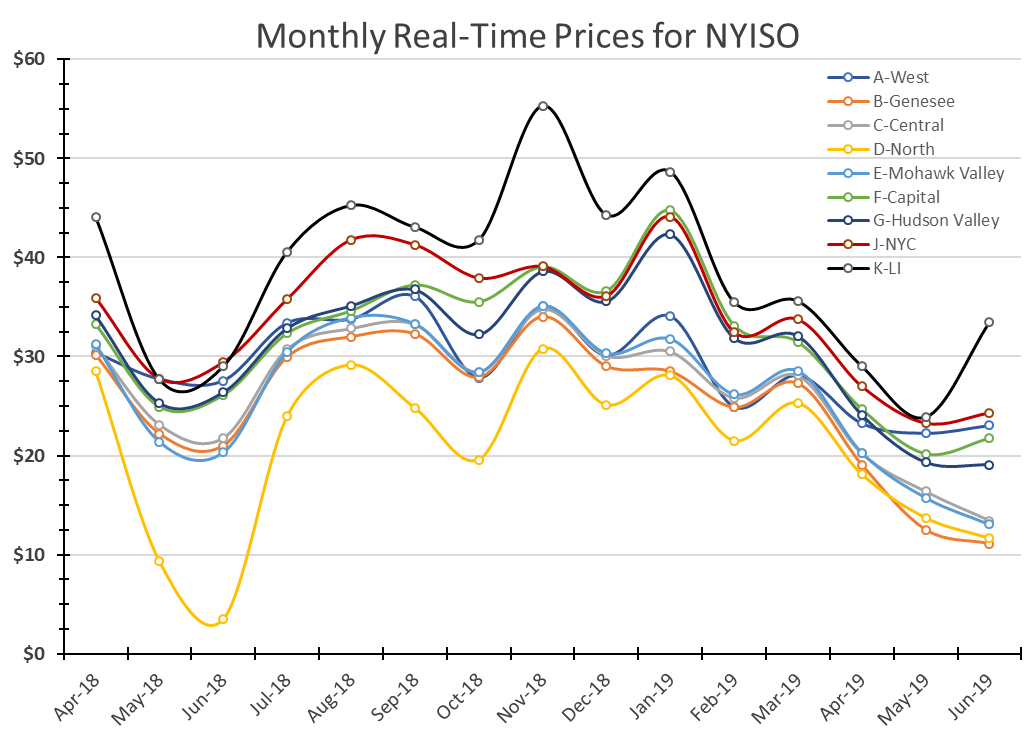 Figure 1: Monthly Real-Time Prices for NYISO Graph, by 5
 Table 1: Monthly Real-Time Prices for NYISO Table, by 5
Drivers of these prices
There are two main drivers of this large drop in spot electricity prices: low natural gas prices and interzonal congestion. Lately, average daily spot gas prices in New York have been very inexpensive. The U.S Energy Information Administration reported that the composite daily spot gas price in New York has varied between $2.10 and $2.30/MMBtu over the last few weeks. These low prices make it very inexpensive for natural gas generators to produce electricity.
The other factor is interzonal congestion. This occurs when there are limitations in power that flow from one zone (see map in Figure 2) to another. Typically, this is caused by constraints in the transmission infrastructure. These constraints create a price separation between the zones on either side of the grid constraint. An example can be seen between Zone A (Buffalo) and Zone B (Rochester). Figure 1 shows that in May and June of this year, Buffalo’s spot electricity price in Zone A has settled almost twice as high as prices for Rochester in Zone B. This congestion can also be seen in the separation in prices between Zone J (NYC) and Zone K (Long Island), or on a larger scale, the difference in prices between the grouping of zones B, C, D and E and all other zones in downstate New York (Zones G to K).
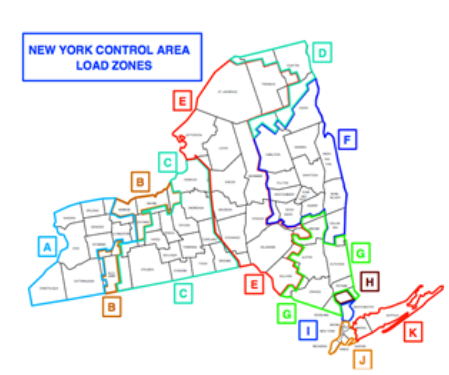 Figure 2: New York Control Area Load Zones Chart, by nyiso.com
The decrease in spot electricity prices over the last couple of months in New York is having two near-term effects. Any customer that is on default service with the utility or on an index rate contract with an electricity supplier will benefit from lower monthly electricity rates, especially in the western and northern parts of New York State. This decrease in monthly spot prices is also beginning to impact the forward market too. The forward price for electricity in Zone A (Buffalo) in June 2020 and June 2021 has fallen by 8% and 5% respectively. Typically, spot electricity prices begin to increase in July and August, as shown in Figure 1, due to the warmer weather. The degree to which those spot prices increase this summer (if at all) remains to be seen.


