This week, a major milestone was reached in the natural gas market. For the first time in two years, the amount of natural gas in storage has exceeded the 5-year average. In Figure 1, the 5-year range of minimum and maximum amounts of gas in storage are shown in the area shaded in gray. The darker blue line is the 5-year average and the red line shows the amount of gas currently in storage. This chart shows that storage levels have been below the 5-year average for the last 25 months. At this time last year, the nation headed into winter with approximately 3,200 Bcf of gas in storage, roughly 15% below the 5-year average.
Large amounts of natural gas were placed into storage after last winter. The steep slope of the red line in Figure 1 beginning in March shows that the gap between storage levels and the 5-year average has continued to close over the last several months. Both mild temperatures and strong amounts of gas production have helped to improve these storage levels. This is good news as we approach the winter heating season because higher amount of gas in storage should put downward pressure on gas prices. The bad news is that storage levels are not the only factor driving the price of gas.
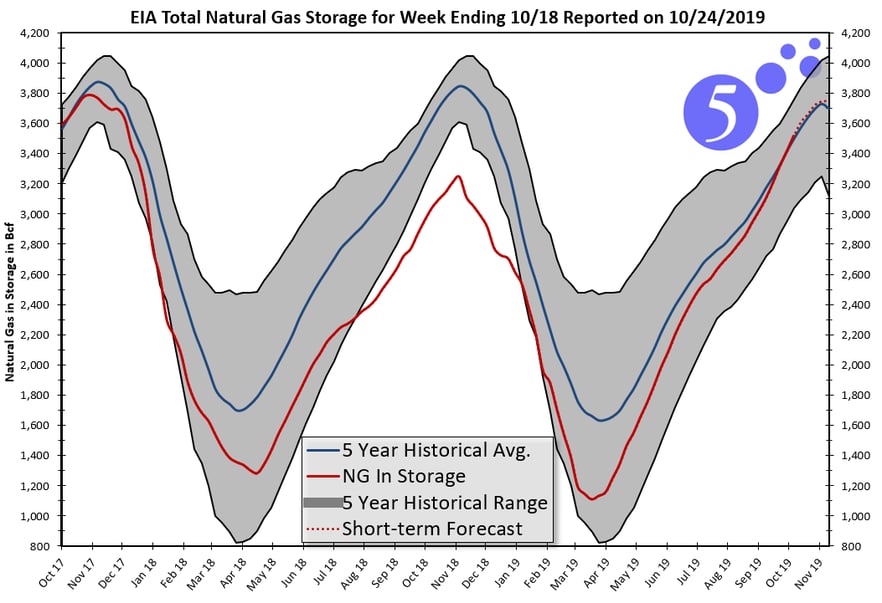 Figure 1: EIA Total Natural Gas Storage for Week Ending 10/18 Reported in 10/24/19, by 5
On August 1st, an underground natural gas pipeline in rural Kentucky exploded. That explosion killed one person, injured several and disrupted the flow of natural gas across the Eastern United States. This explosion happened along a section of the Texas Eastern Transmission (TETCO) system, which is a major interstate pipeline that moves natural gas from the Utica and Marcellus shale reserves in Ohio and Pennsylvania to markets both in the Northeast and the Gulf Coast. The location of the pipeline rupture and explosion is shown in Figure 2.
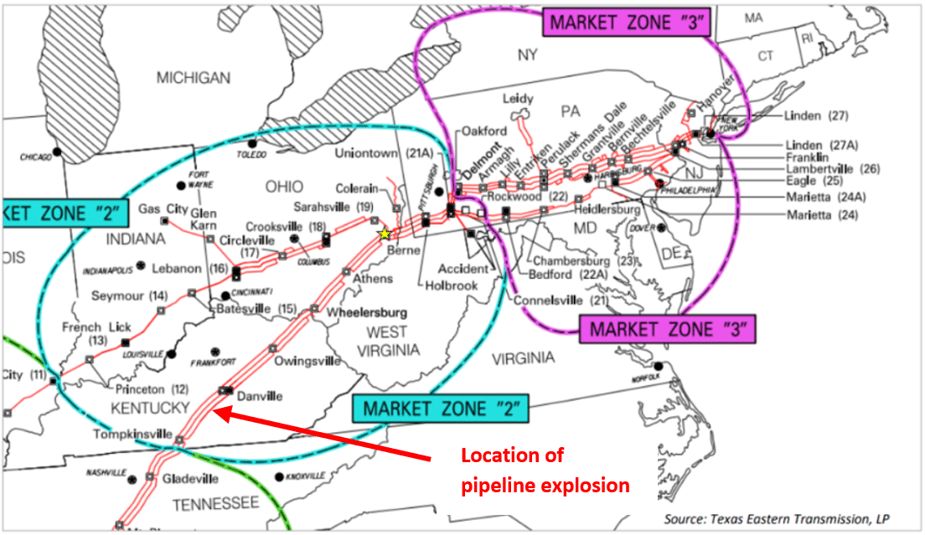 Figure 2: Location of Pipeline Rupture and Explosion Along Texas Eastern Transmission (TETCO), by Texas Eastern Transmission, LP
In the immediate wake of this accident, natural gas basis prices increased dramatically. As a precaution, the pressures and volumes of gas anticipated to flow throughout the TETCO system this winter were reduced by 15%. Figure 3 shows that winter basis prices nearly doubled from $1.50/MMBtu to almost $3.00/MMBtu at the TETCO M3 trading hub, which covers most of Eastern Pennsylvania, Maryland, Delaware, New Jersey and parts of New York. This is significant because in the Northeast, the highest demand for natural gas occurs between the months of December through March. Even though storage levels are in a good place heading into winter, these pipeline constraints are having a bullish effect on near-term prices.
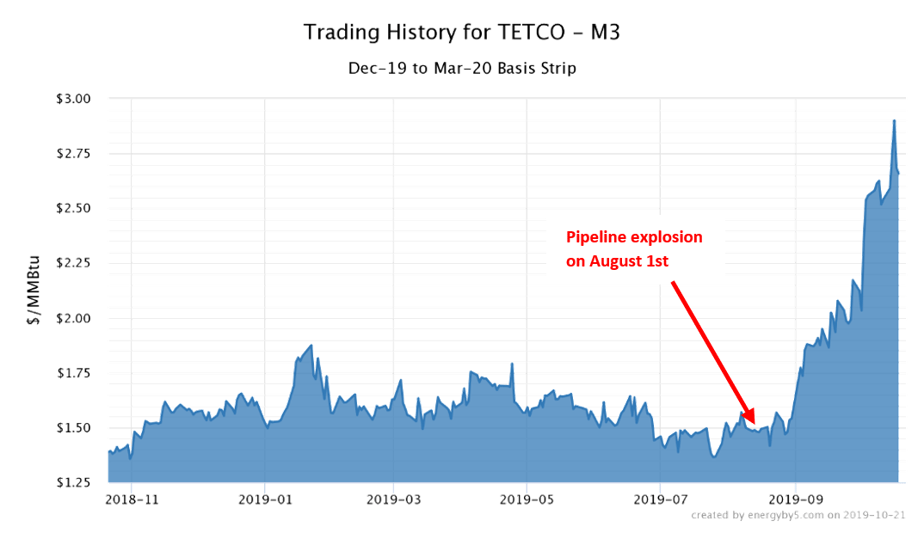 Figure 3: Trading History for TETCO - M3, by 5
Questions about the ability of the TETCO system to operate at full capacity have also had an impact on longer-term gas prices. Figure 4 shows natural gas futures prices for calendar years 2020 through 2024 at TETCO M3. The biggest rally in gas futures can be seen in calendar year 2020 (dark blue line) as the price of that calendar strip rose from $2.67/MMBtu to $3.03/MMBtu over the last two months. Prices also rallied in calendar year 2021 from $2.65/MMBtu to $2.81/MMBtu. Most traders believe this bullish trend can be attributed to the uncertainty of the TETCO system returning to its full capacity.
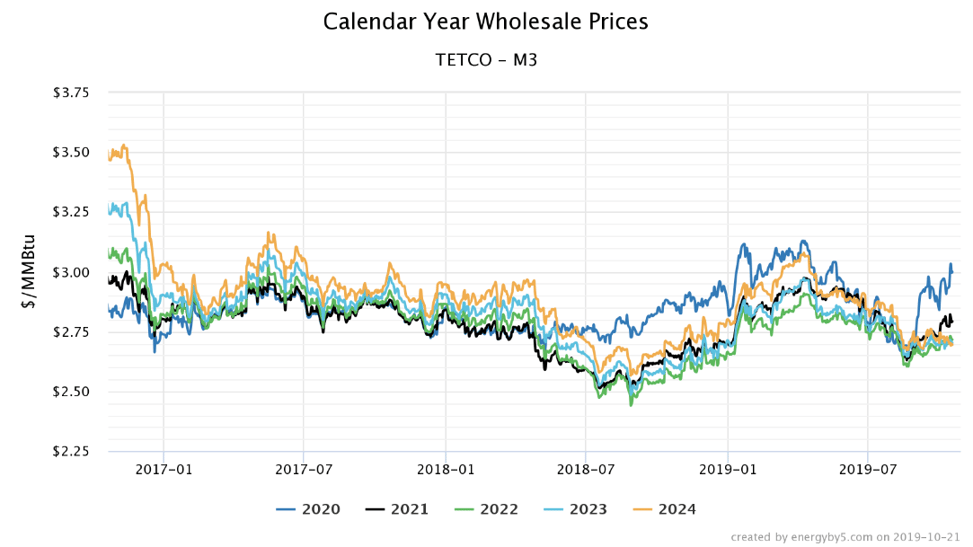 Figure 4: Calendar Year Wholesale Prices, by 5
Despite the fact that gas futures have risen over the past two months, overall, prices remain in an attractive place to make a purchase. As Figure 4 shows, calendar years 2020 through 2024 were trading at prices in excess of $2.80/MMBtu two years ago. And in the summer of 2016, those calendar years were trading between $3.00 and $4.00/MMBtu. While clients with open gas positions in 2020 and beyond should expect to pay a little more compared to where the market was trading this summer, that premium is not significant compared to where gas futures have traded historically.


