
As the calendar flips from August to September, ICAP management season is winding down, school is back in session and both the Mets and the Yankees are in first place. And while this summer was pretty hot for New York baseball, it was very ordinary in terms of the temperature. The months of July and August are particularly important for electricity customers in New York because a significant portion of next year’s electricity bill, the capacity obligation, is based on how much electricity a meter uses on the grid’s one highest hour of demand during those two months.
Overall, in New York City, temperatures this summer were consistent with average high temperatures over the last decade. The blue line in Figure 1 is the average daily temperature for the months of July and August within the daily temperature range, shown in gray. Note that there were only four days where the high temperature was more than 95 F. Figure 2 shows that the summer of 2022 was relatively normal compared to the last twelve years. It should be no surprise that one of the four days (July 20) that was over 95 F was also the peak electricity demand day on the grid.
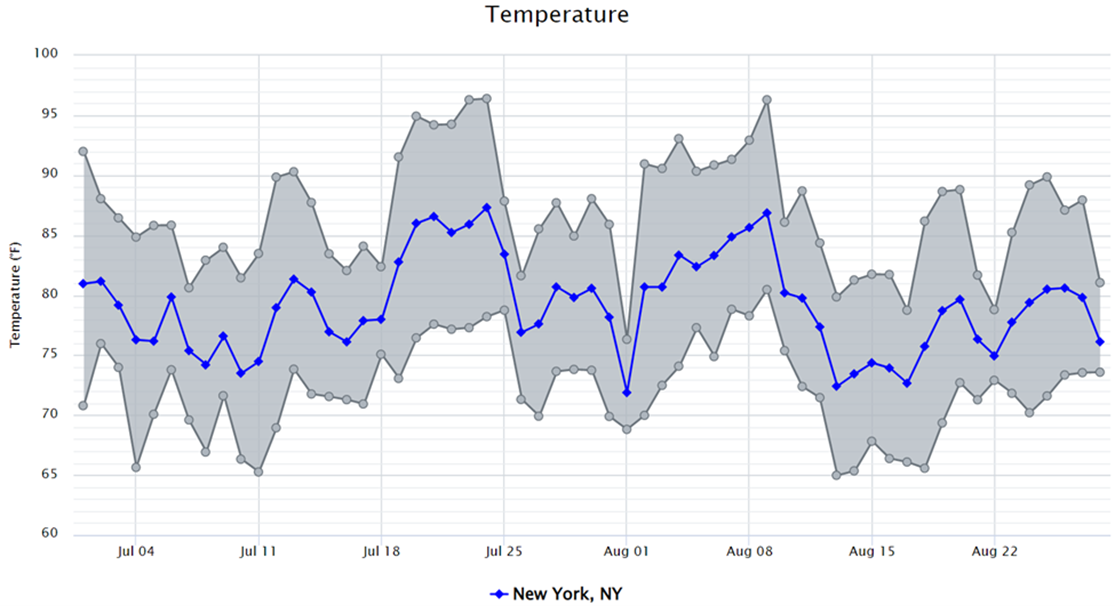
Figure 1: July 1 – Aug 29, 2022, Daily Temperature Stats, NYC from 5
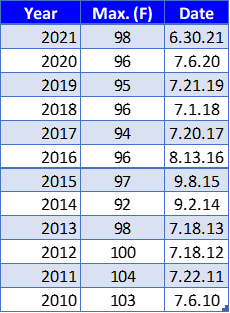
Figure 2: High Temperatures by Year in NYC from 5
The two warmest non-weekend days were Wednesday, July 20, and Tuesday, August 9, which had average daily temperatures of 88.4 F and 87.9 F respectively. Those two days also had the two highest one-hour demand intervals of 30,505 MW and 30,221 MW as shown in Figure 3. The maximum hour of demand for both of those days was between the hours of 5:00 to 6:00 PM ET. This means the unofficial 1CP hour for the summer of 2022 was during the Hour Ending 6:00 PM on July 20. Any electricity account with an hourly meter will have next year’s capacity obligation based on its consumption during that one hour.
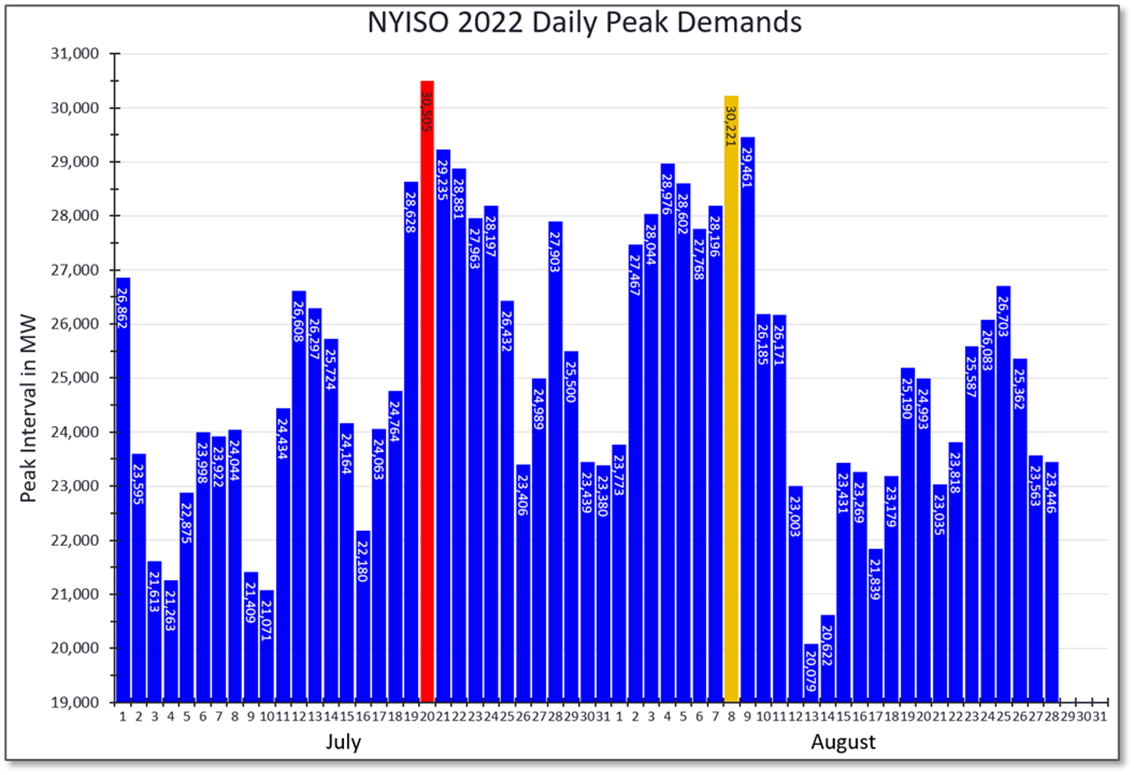
Figure 3: NYISO Daily Peak Demands for July & August 2022 from 5
A second variable that determines one’s total capacity obligation for next year is how the final NYISO peak quantity compared to the value that was modeled and anticipated prior to the summer. In the New York capacity model, the state forecasted a peak demand of 31,766 MWs, which is 1,261 MWs (4%) more than the actual peak demand of 30,505 MWs set on July 20. A correction factor of 4% will be applied to all hourly meters during that peak hour to account for the difference between actual and forecasted peak demand values. Last year, the grid peaked at 30,309 MWs during the Hour Ending at 5:00 PM ET. And while there is a less than 1% difference in peak demand values, the fact that the grid reached its peak an hour later this year may benefit some commercial clients whose electricity usage typically begins to trail off later in the afternoon. Demand values for most hourly meters should already be available from the local utility to determine your facility’s peak electricity demand on July 20, between the hours of 5 and 6:00 PM.


